Question 5June 20260455/111 mark

Show answer
ACorrect answer
Cambridge 0455, Paper 1 & 2. 2,888 questions, 2019 to 2026.
Paper 1 multiple-choice questions and Paper 2 structured questions, from the original Cambridge material. Paper 2 case studies and mark schemes are reproduced as extracted text, with data tables and charts kept as cropped images rather than retyped. A question tagged under a second chapter shows that as a cross-link; it is only filed once, under its primary chapter.
Individual and market demand, drawing and reading demand curves, and the conditions of demand that shift the curve, such as income, the prices of related goods, tastes and advertising.
207 past paper questions on this topic since 2019, across 32 exam sessions.
| Year | Paper 1 | Paper 2 | Total | Chart |
|---|---|---|---|---|
| 2026 | 9 | 4 | 13 | |
| 2025 | 22 | 5 | 27 | |
| 2024 | 19 | 9 | 28 | |
| 2023 | 21 | 8 | 29 | |
| 2022 | 24 | 9 | 33 | |
| 2021 | 15 | 5 | 20 | |
| 2020 | 20 | 7 | 27 | |
| 2019 | 24 | 6 | 30 |
The whole topic on one page, with answers and mark schemes. Printing this page prints just this list.
ACorrect answer
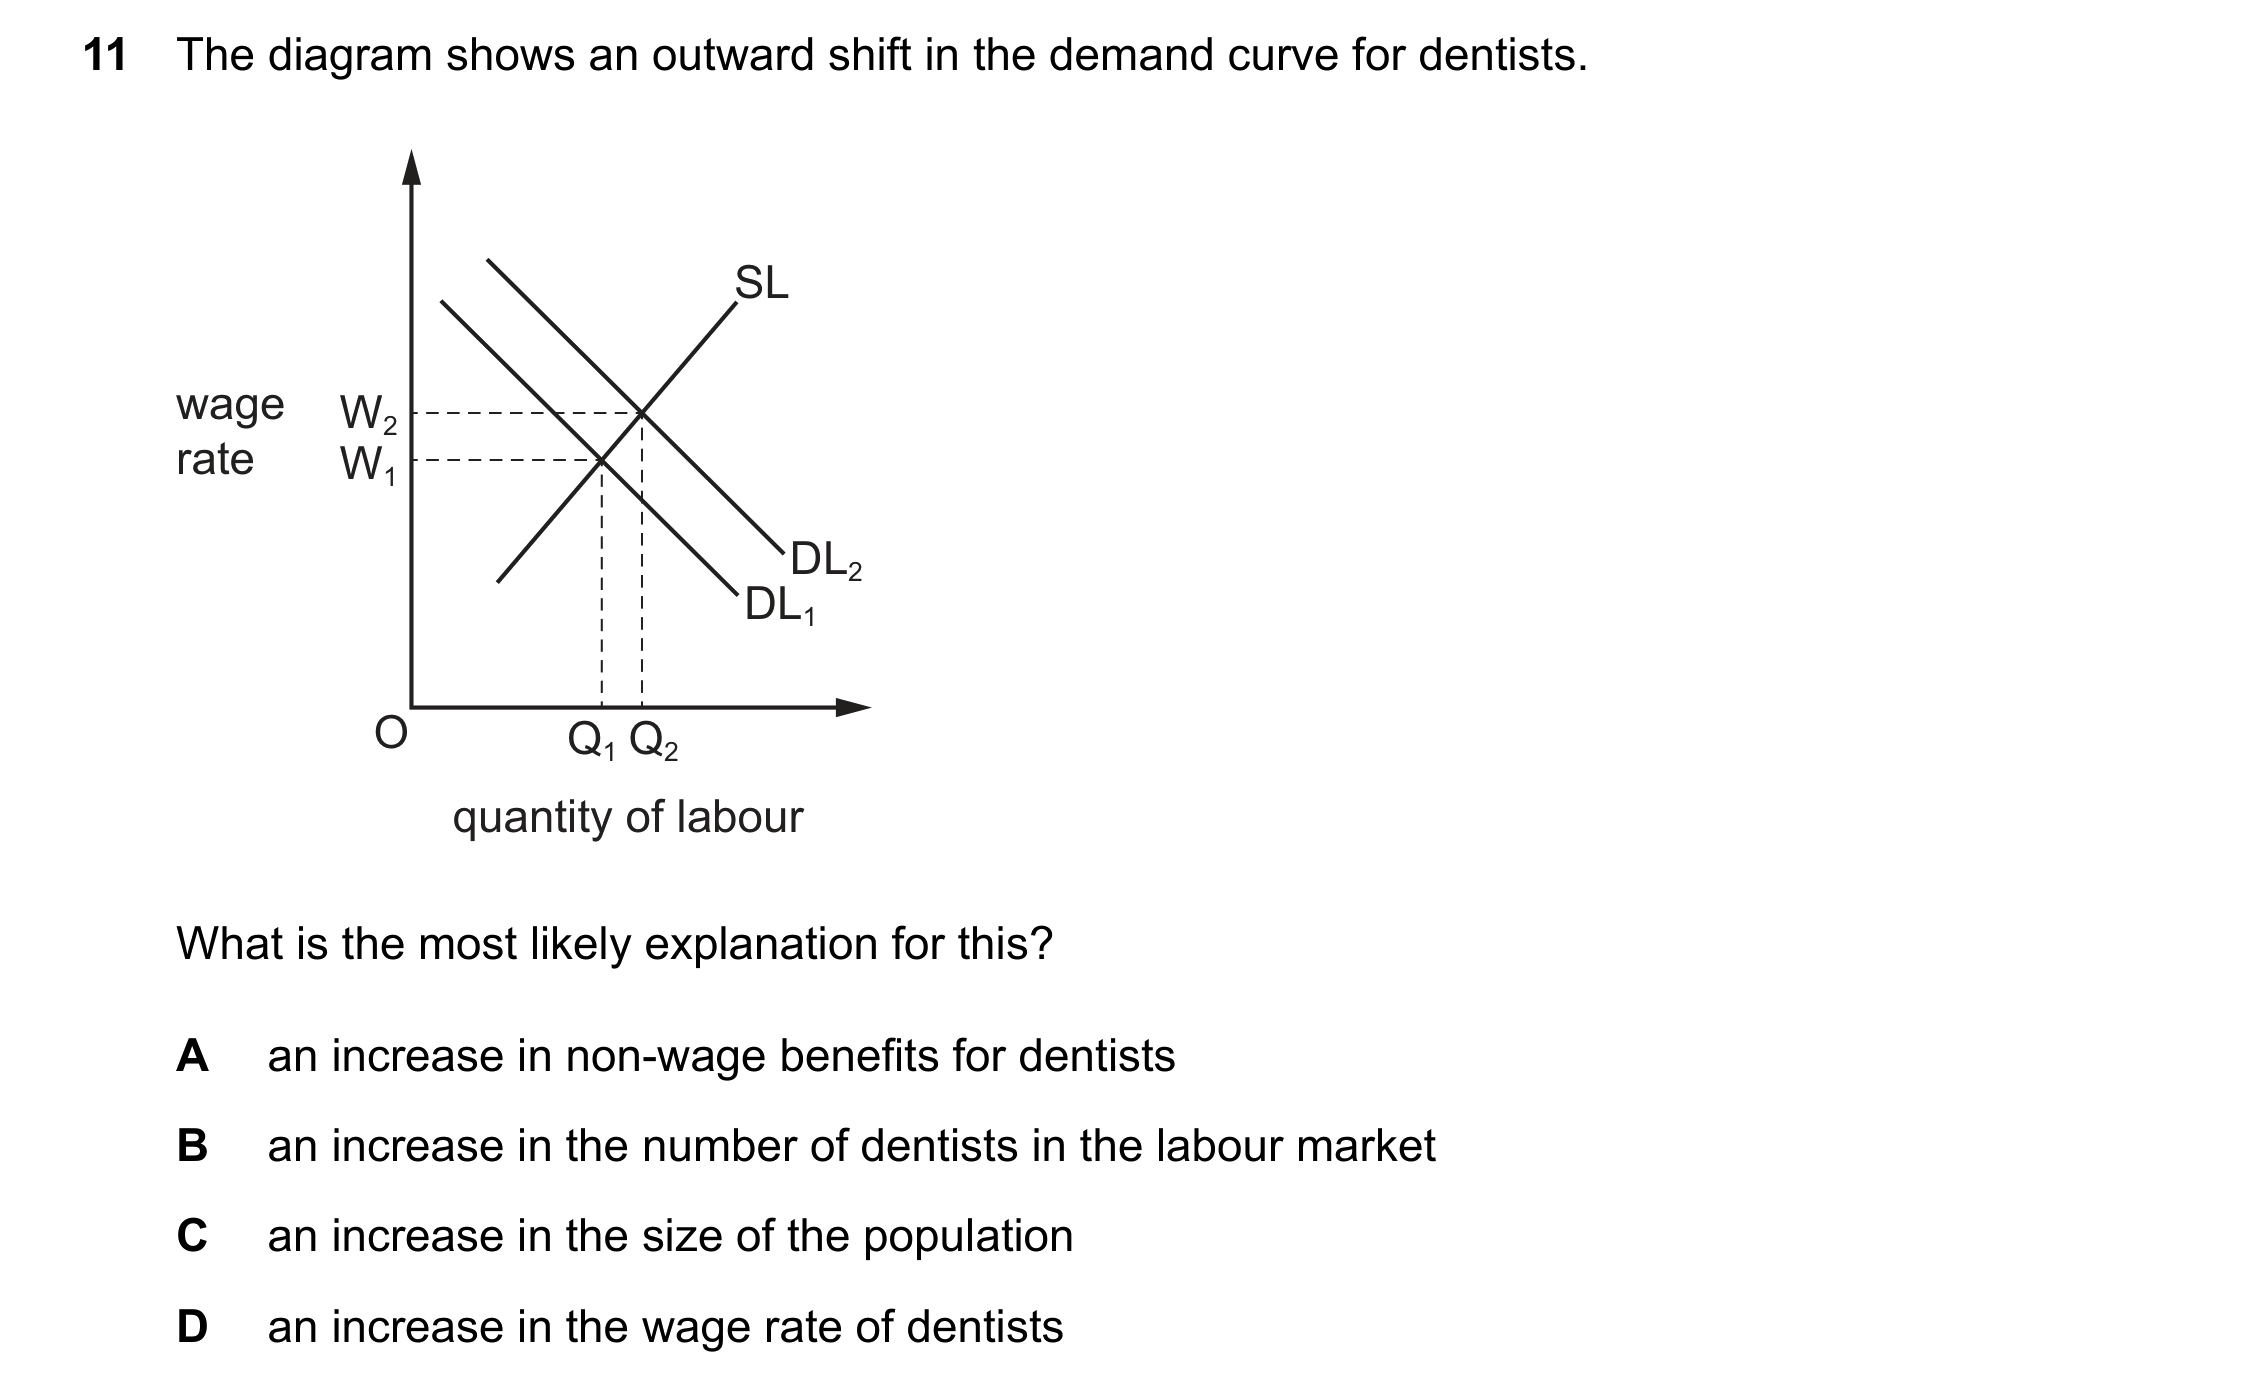
CCorrect answer
What will increase the strength of a trade union of workers who produce cars?
CCorrect answer

CCorrect answer

CCorrect answer
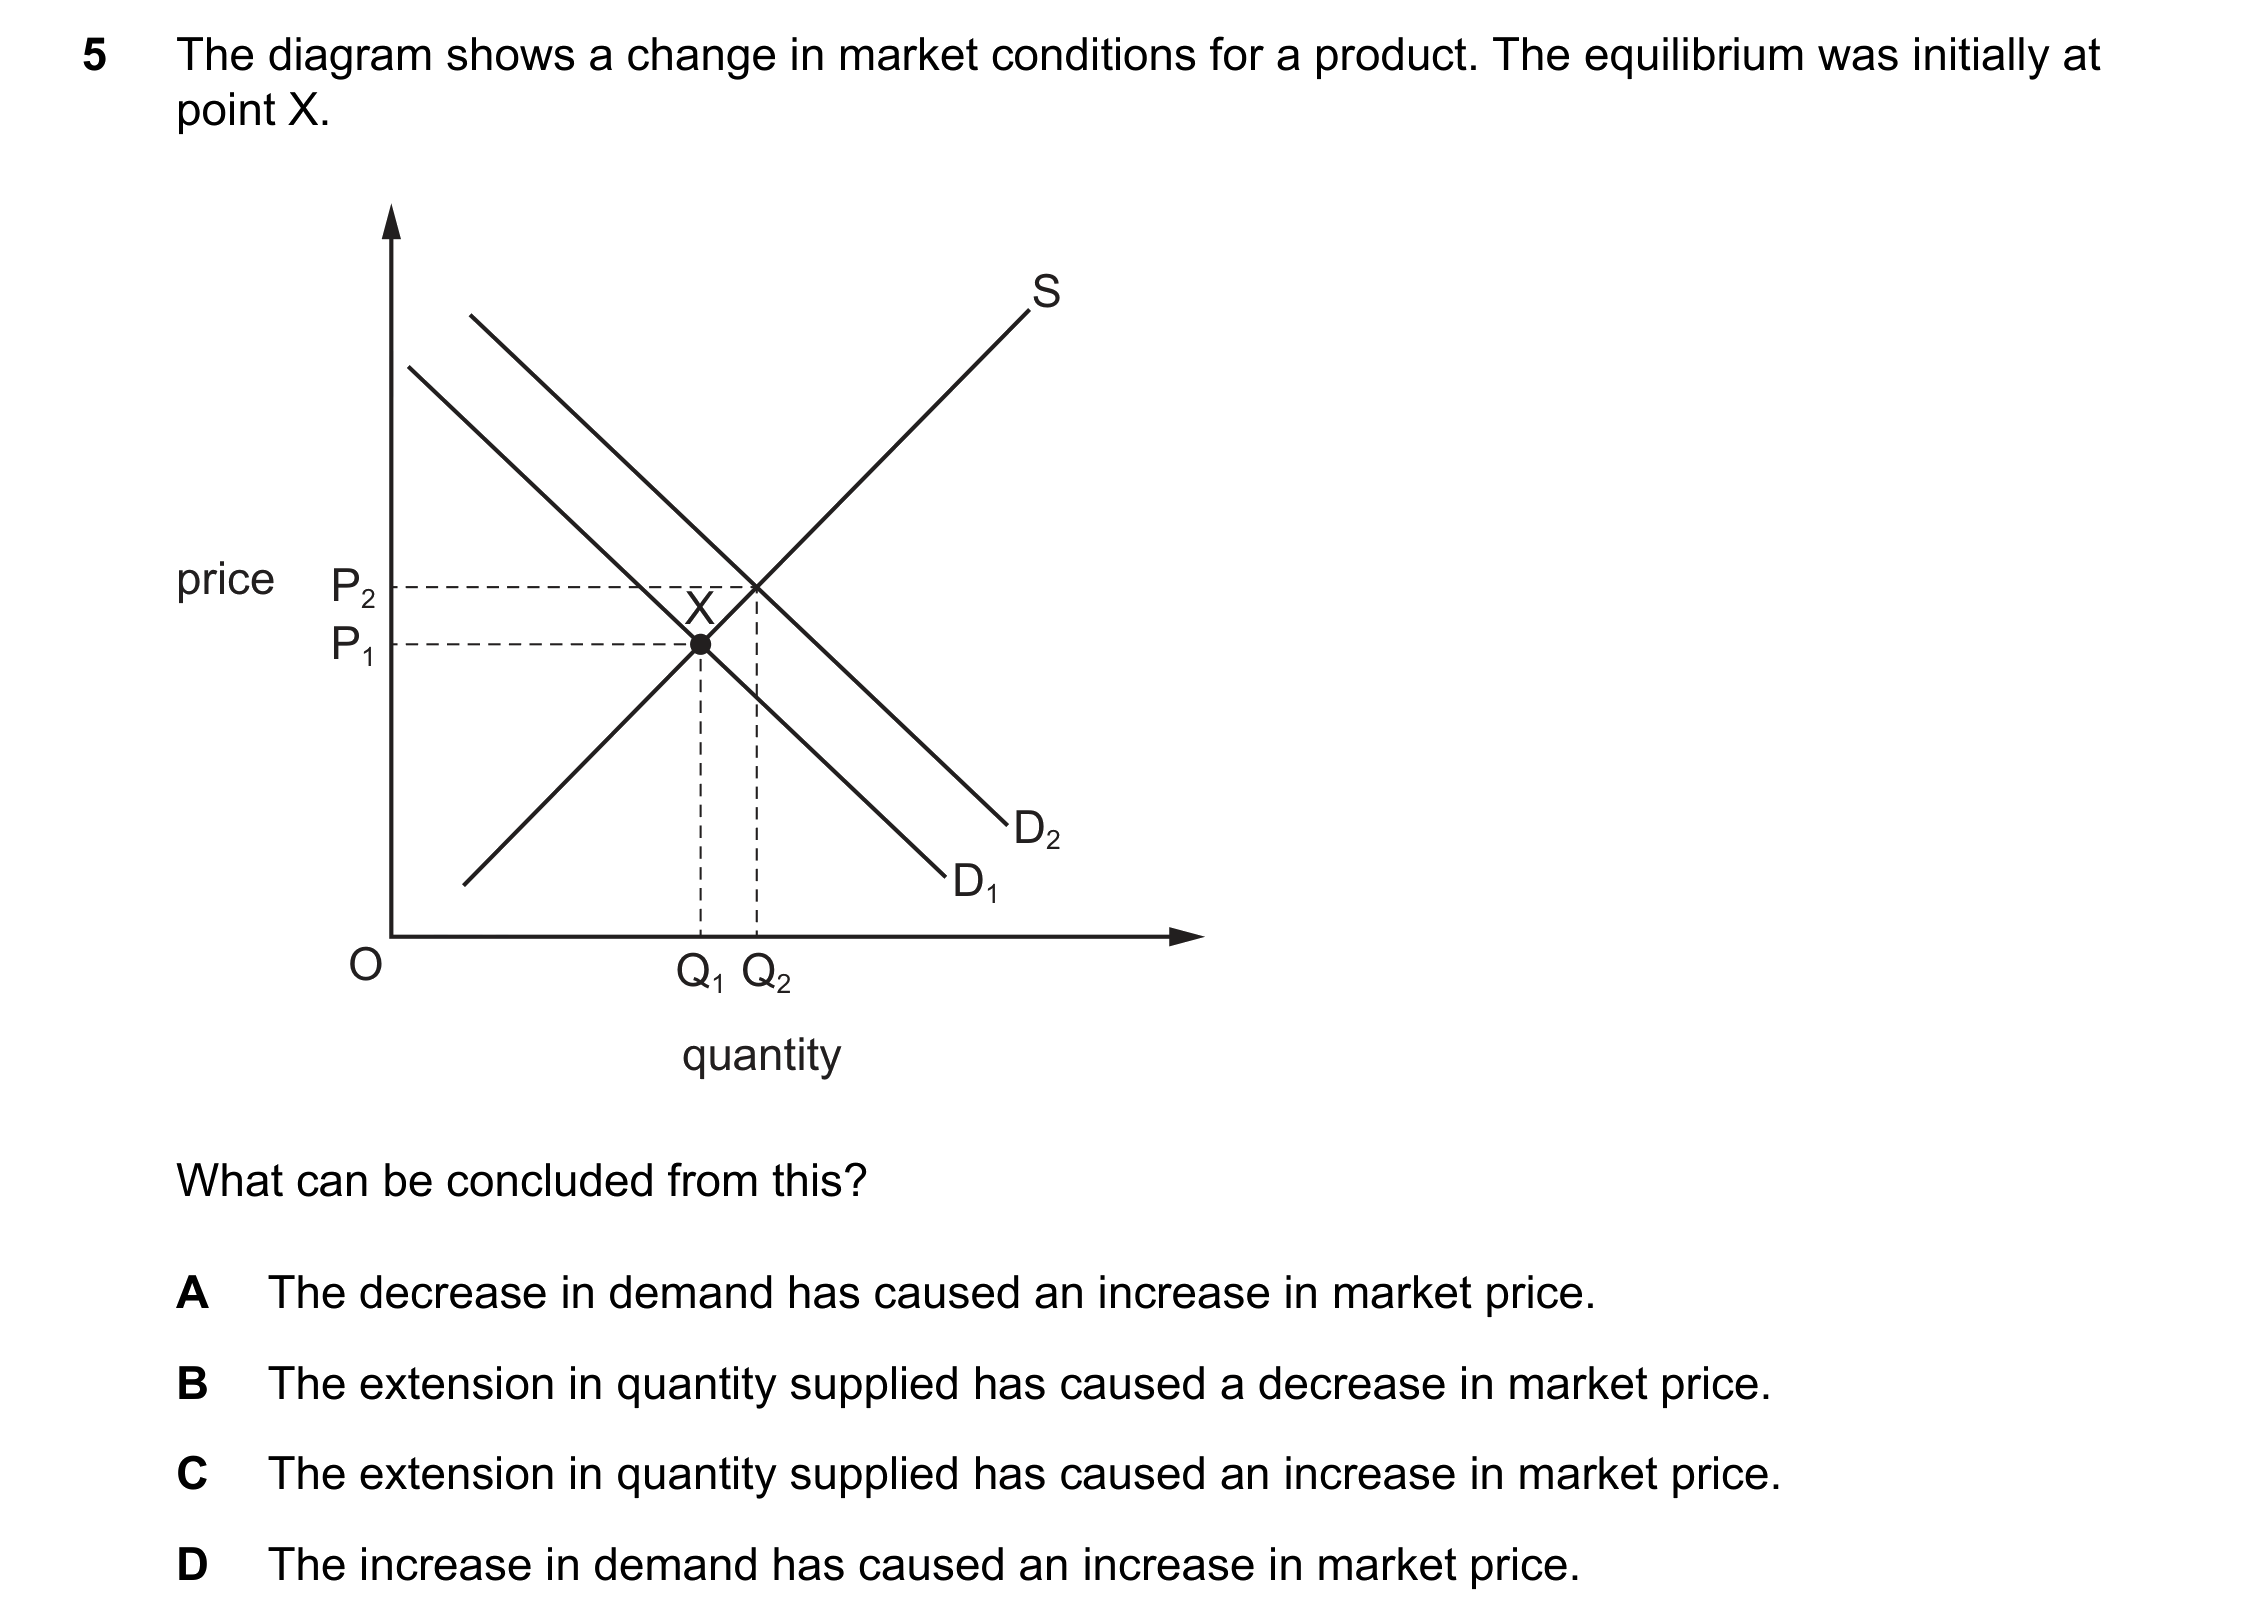
DCorrect answer
What is likely to reduce the price of an airline’s flights?
ACorrect answer

ACorrect answer
On average, doctors earn more than bus drivers. Which change would be likely to reduce the earnings gap between doctors and bus drivers?
BCorrect answer
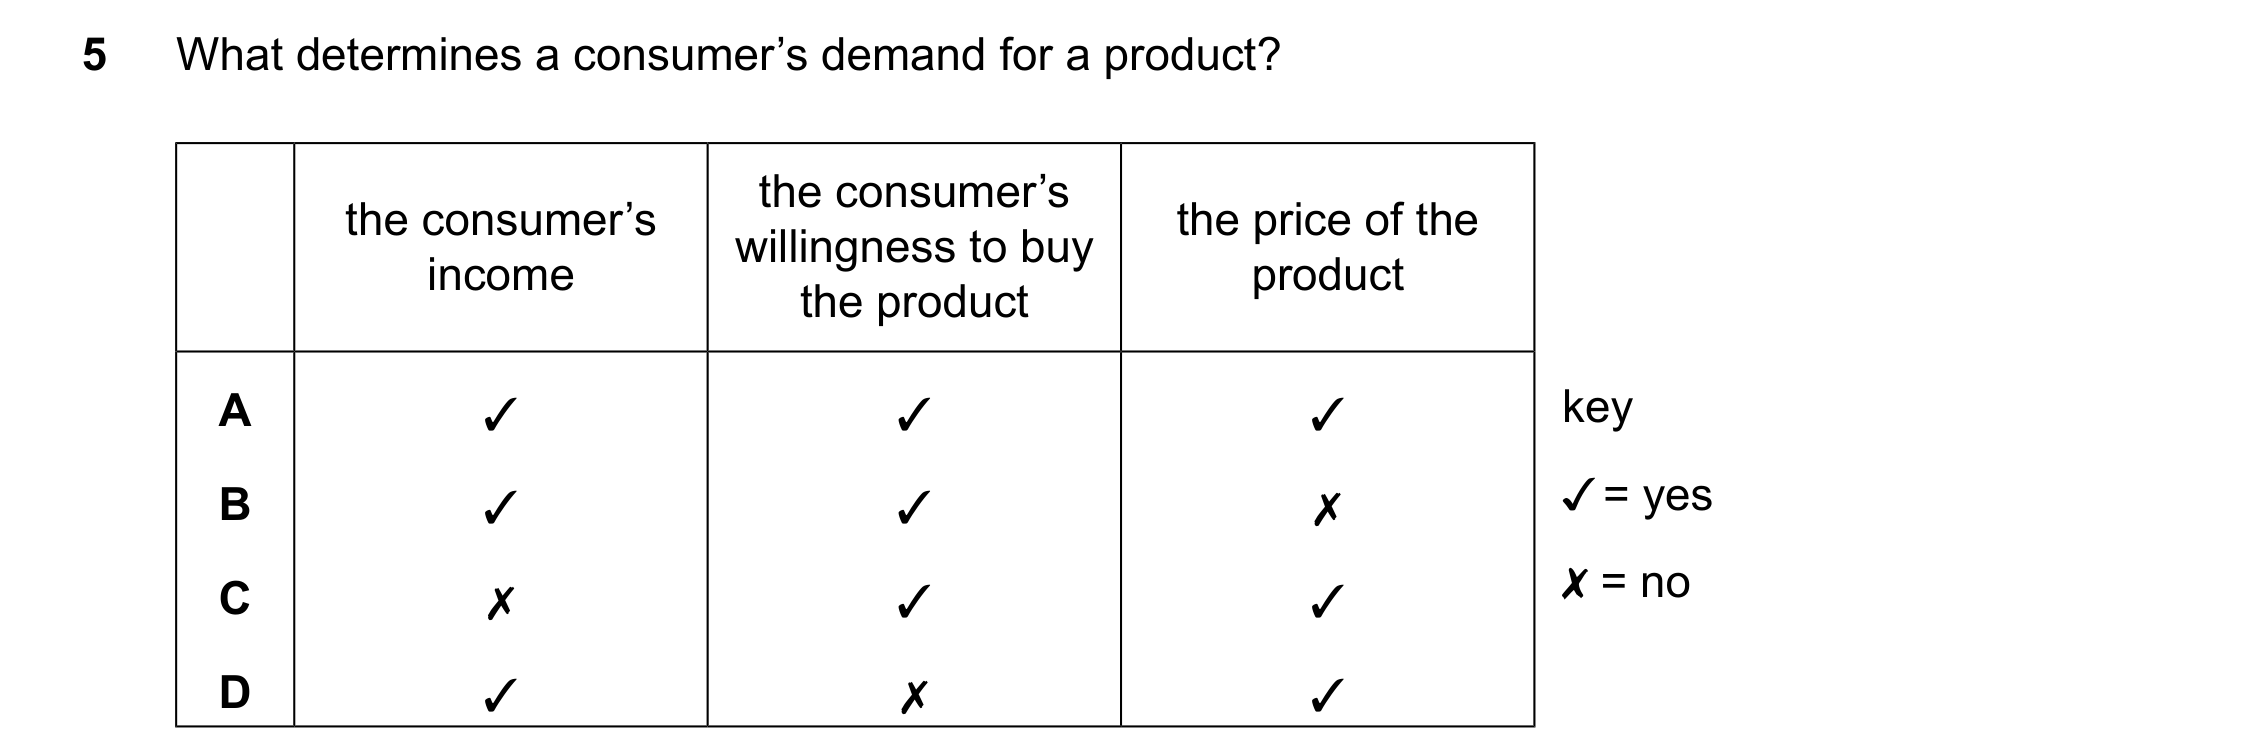
ACorrect answer

DCorrect answer
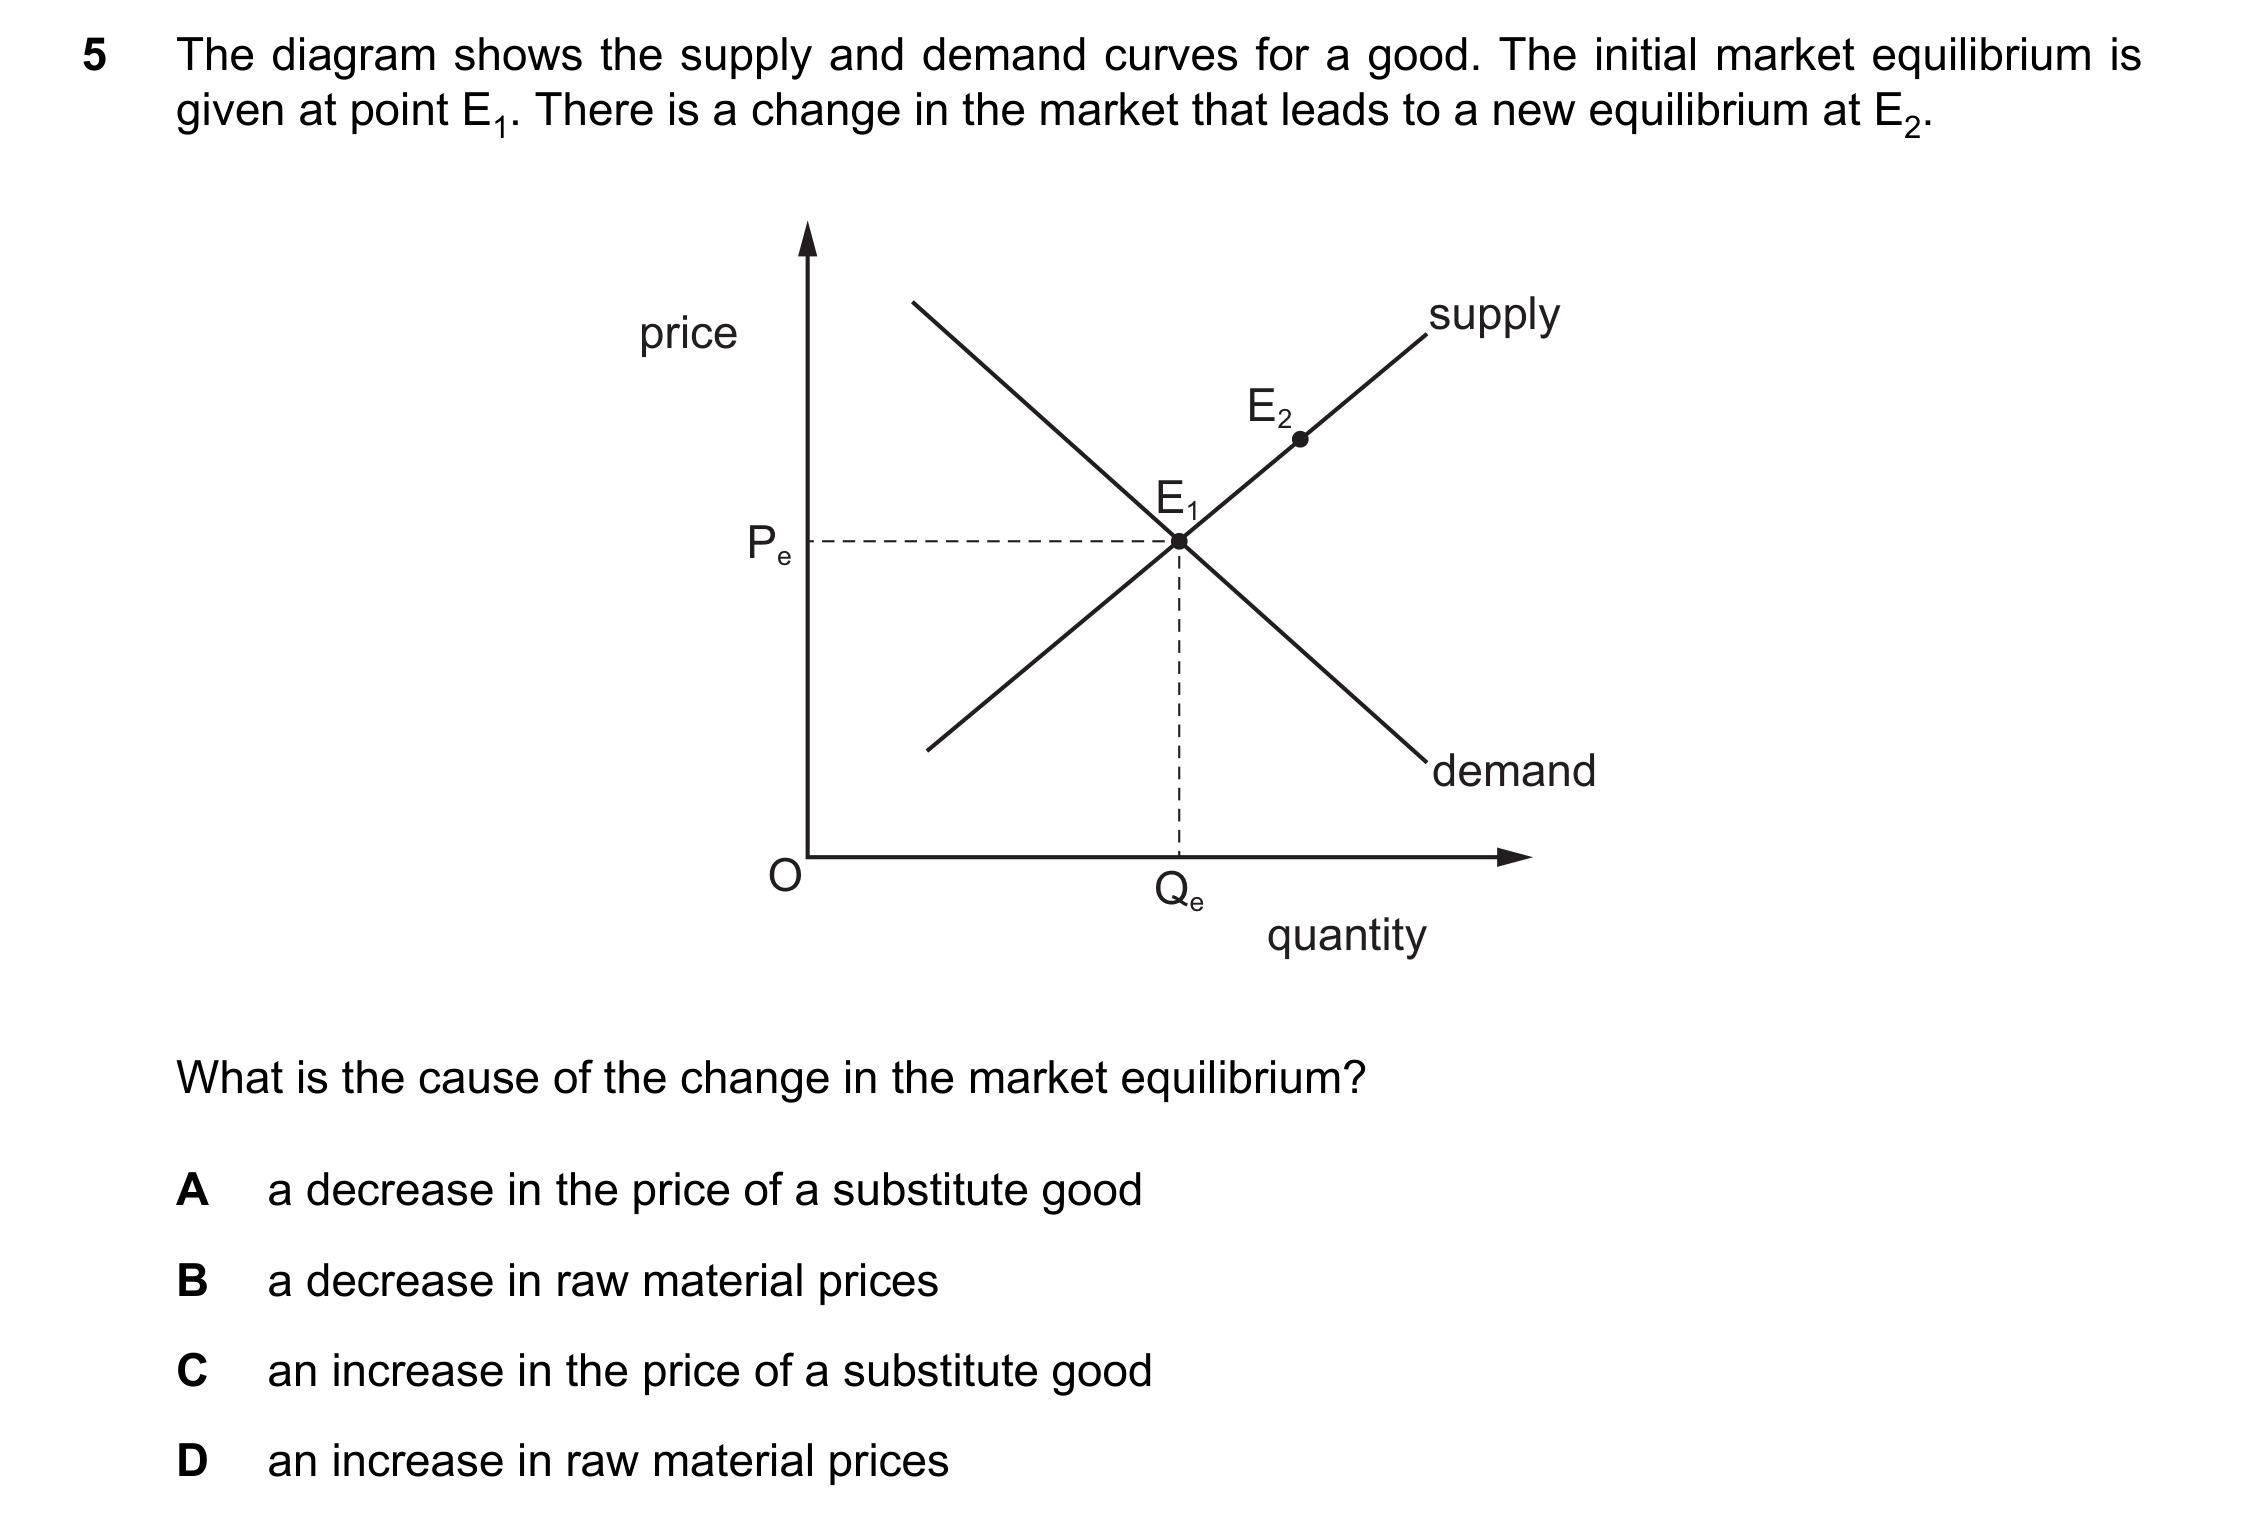
CCorrect answer
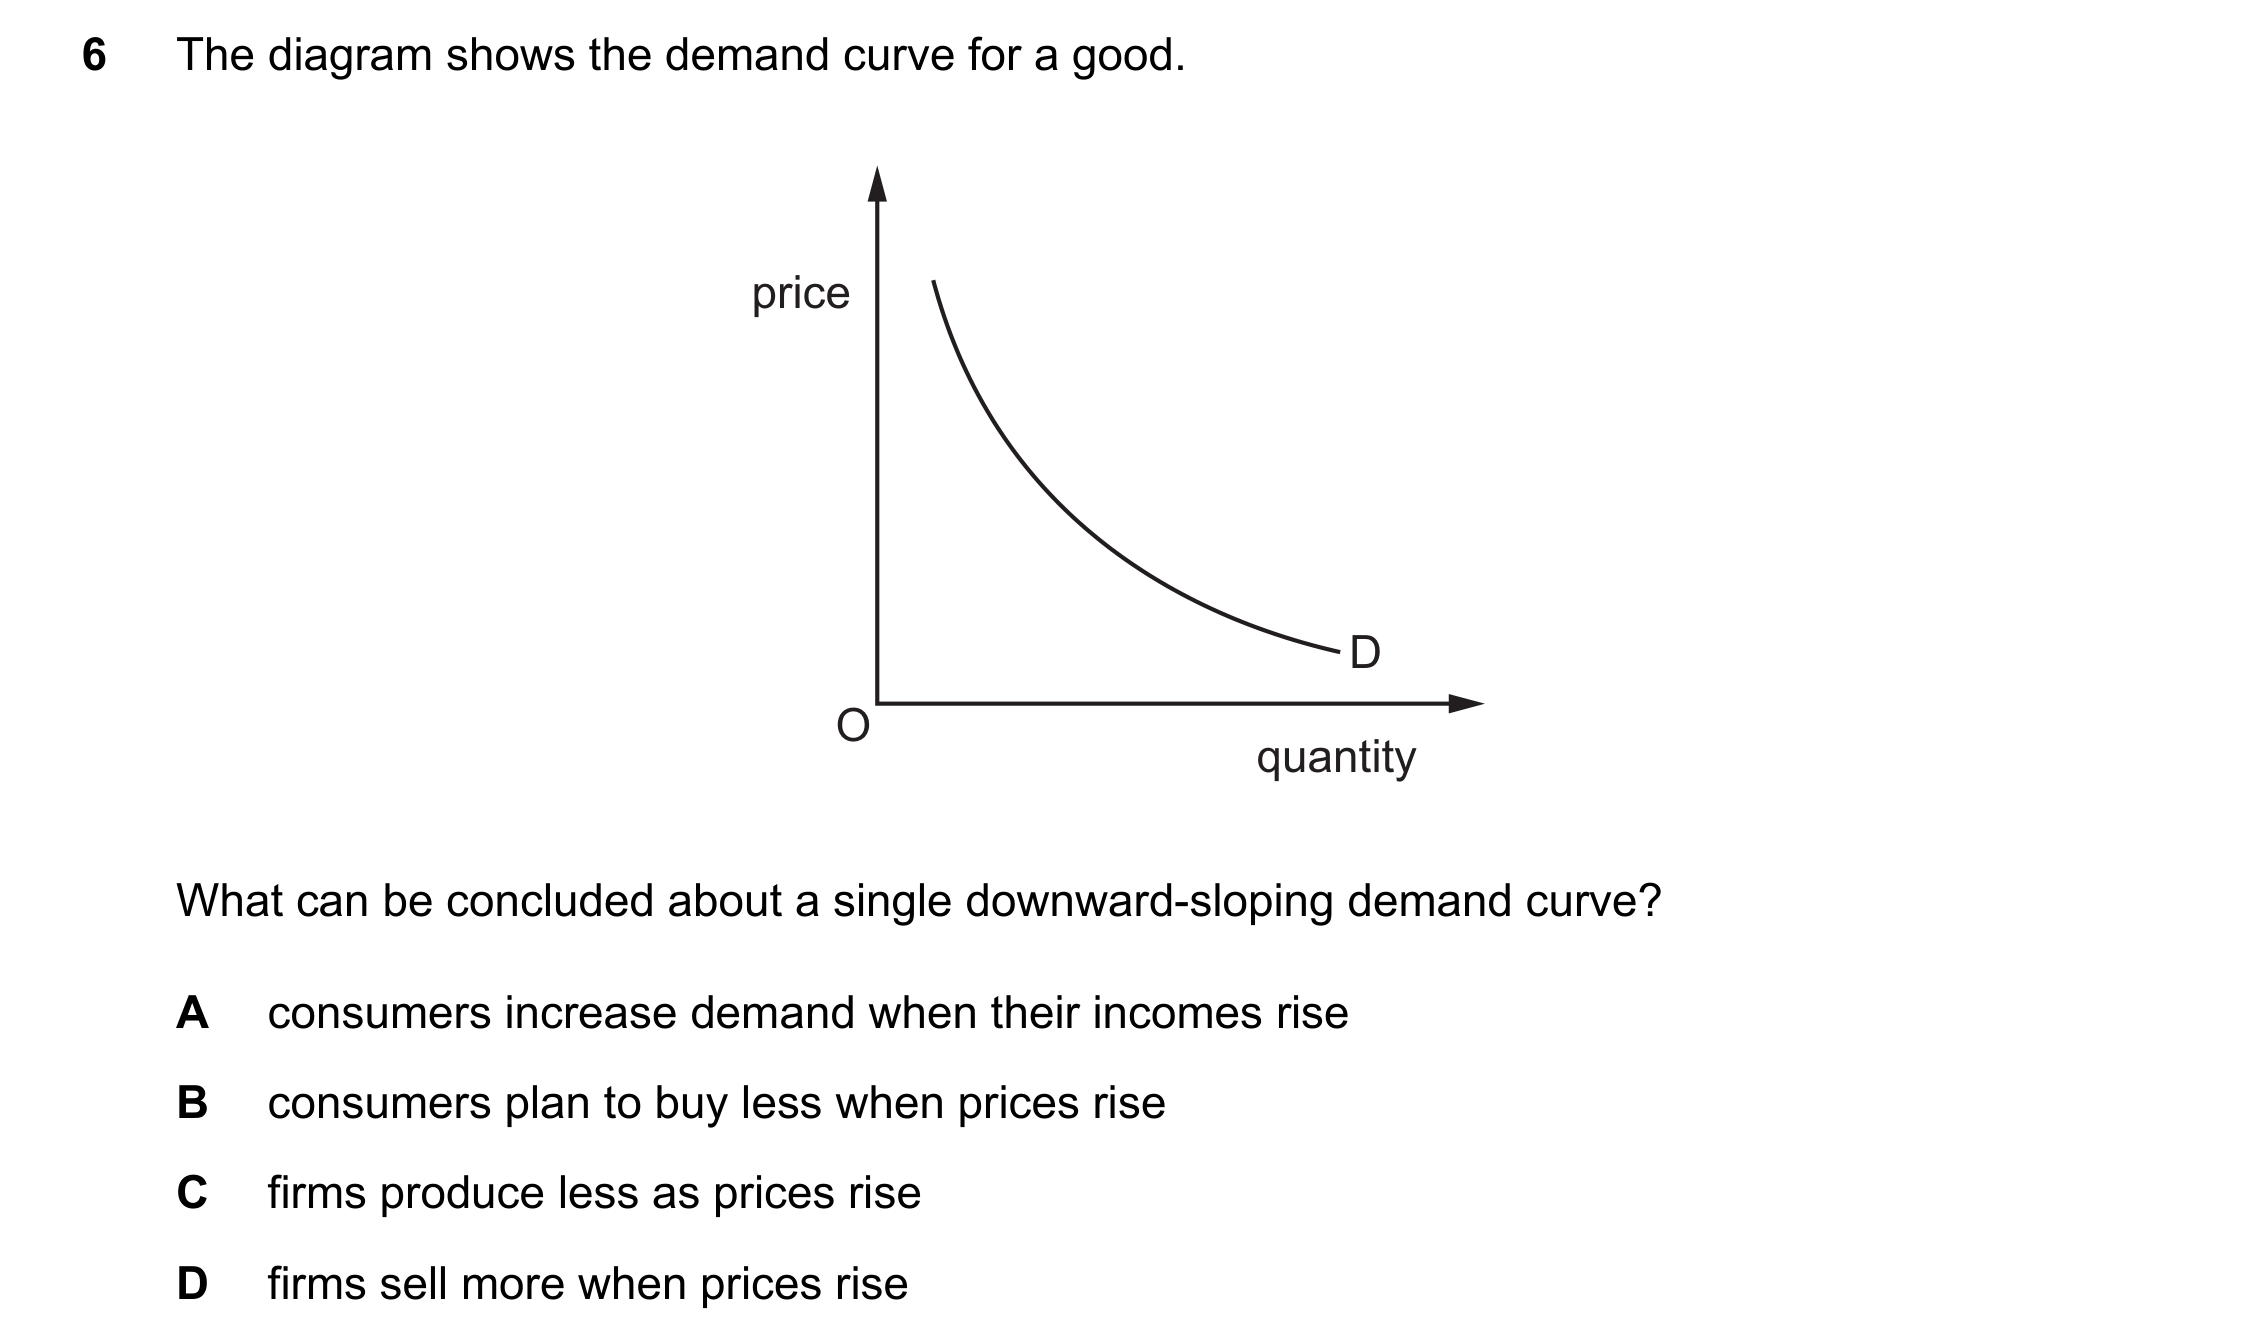
BCorrect answer
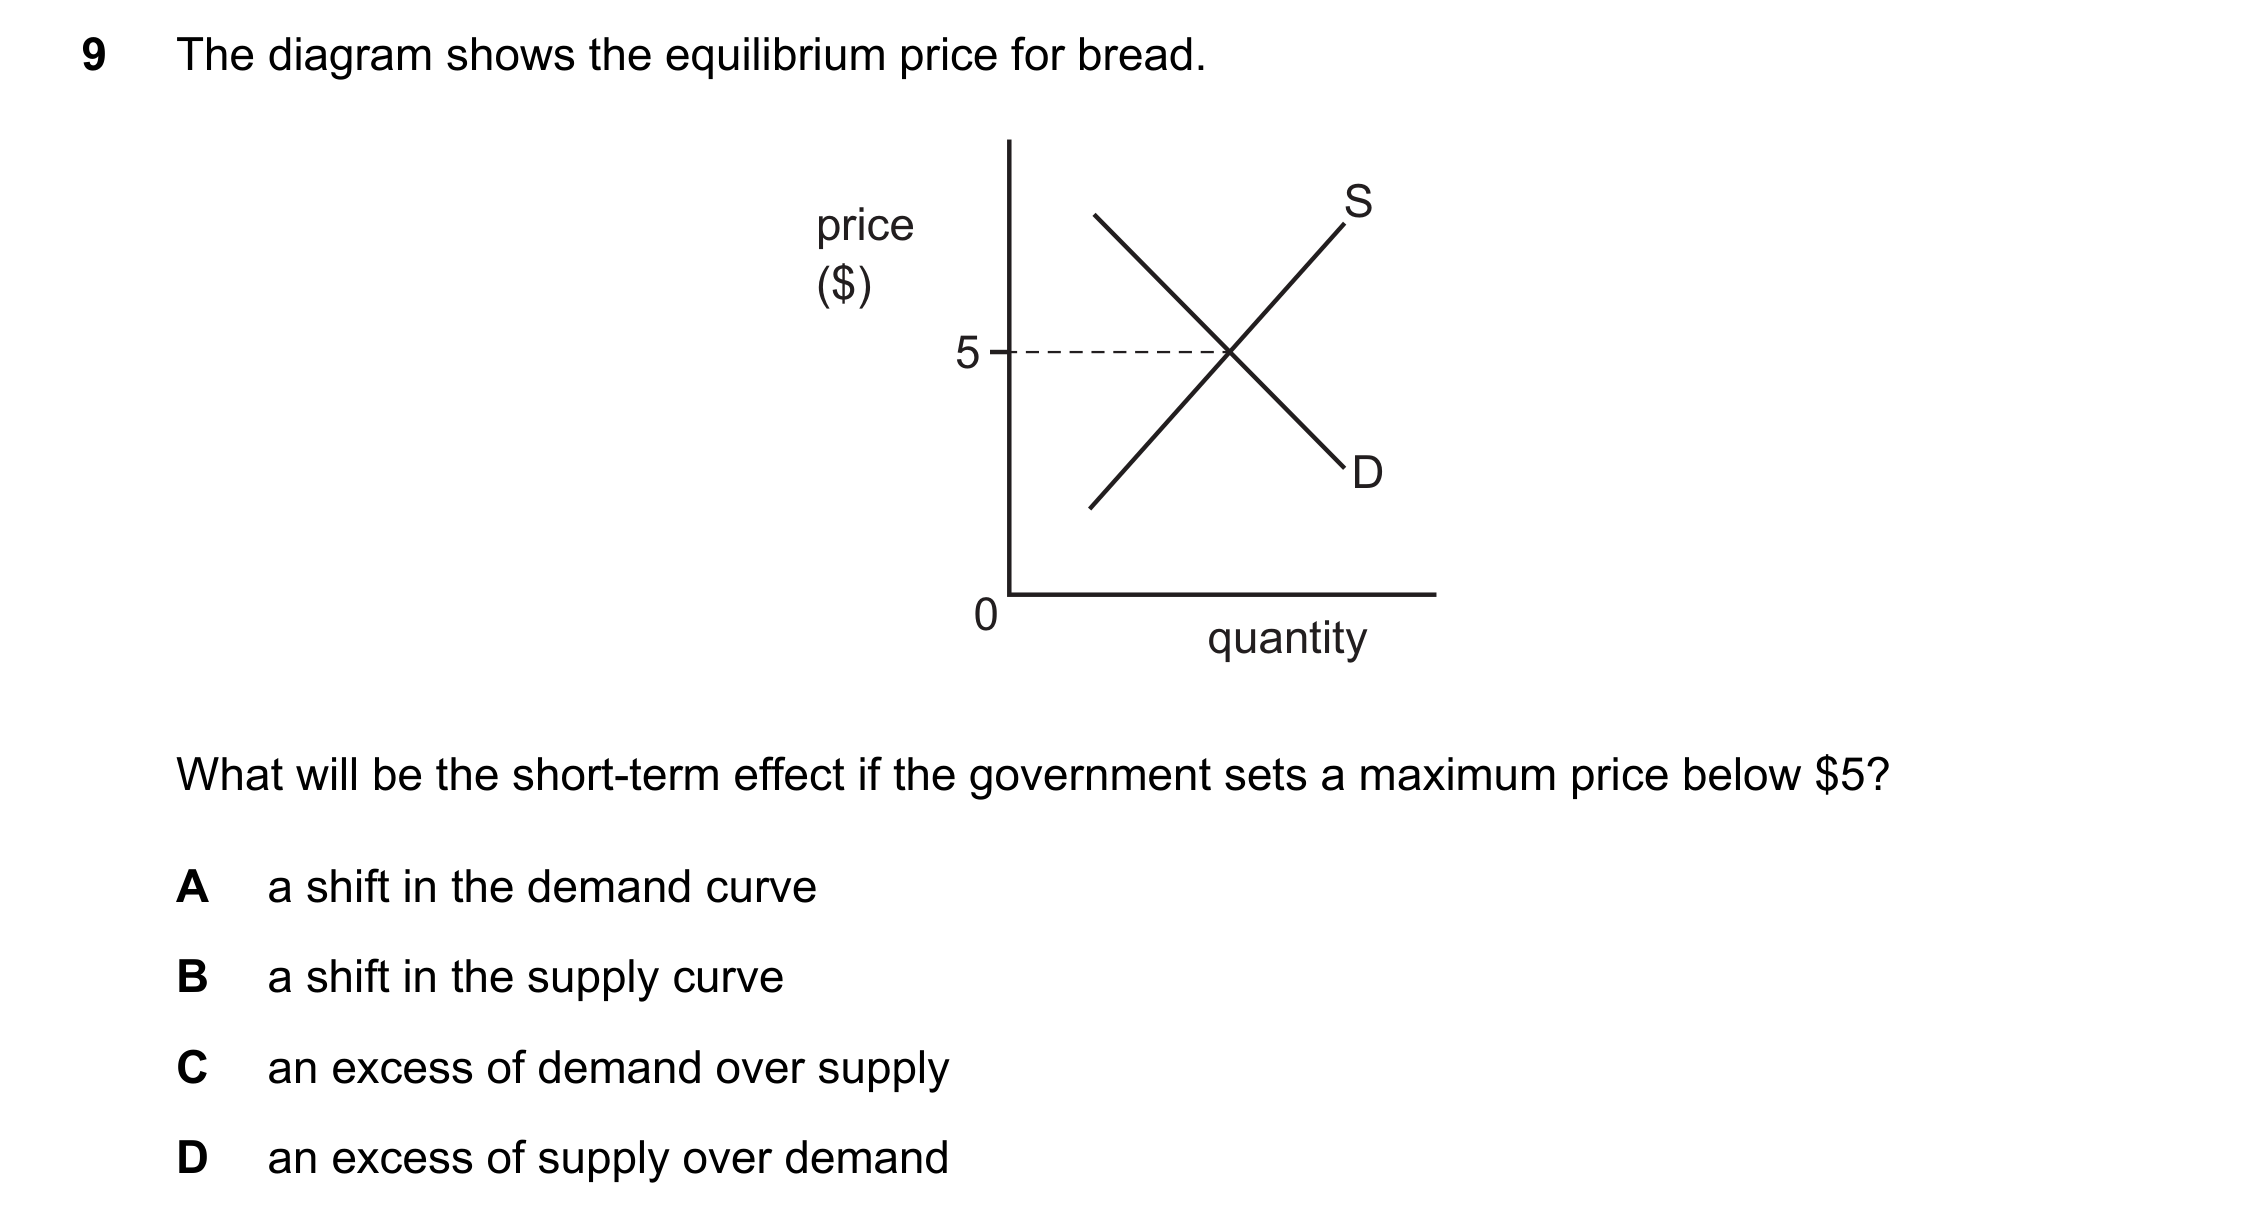
CCorrect answer
Worker X earns less than worker Y. What is most likely to be true of worker X?
DCorrect answer

BCorrect answer
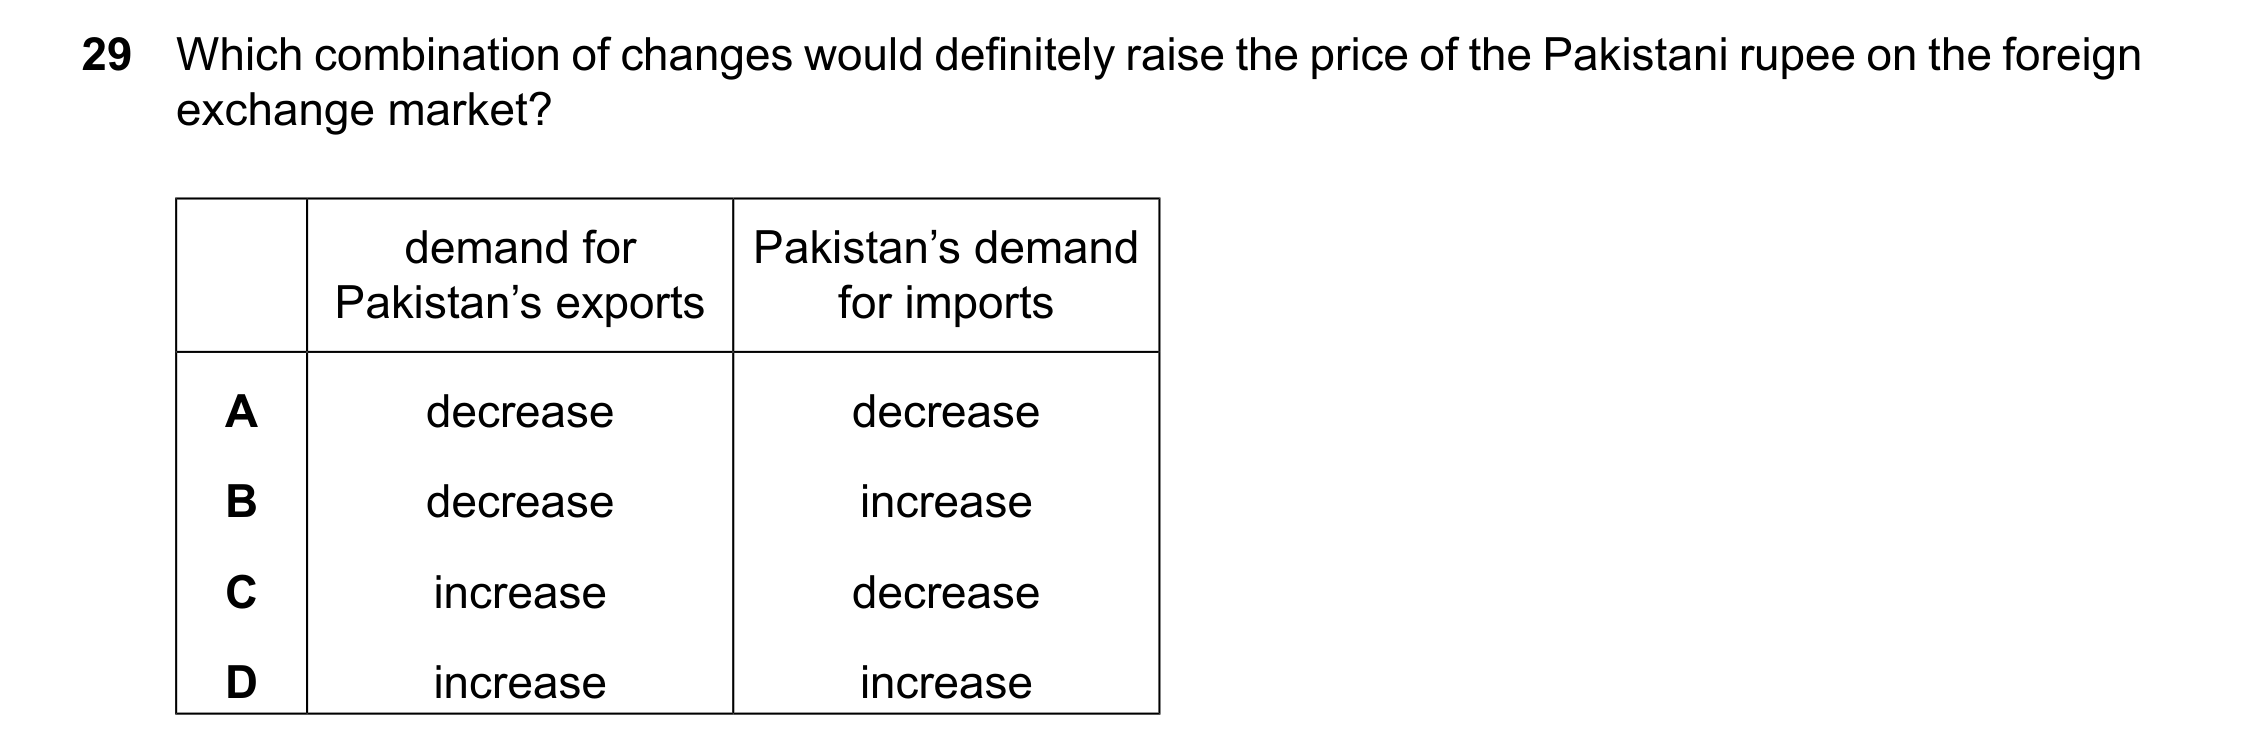
CCorrect answer
In 2020, to prevent the spread of a pandemic, many governments temporarily closed restaurants and cafés. What would be a macroeconomic impact of such a policy?
BCorrect answer

DCorrect answer

DCorrect answer
What will increase the level of specialisation in an economy?
DCorrect answer

BCorrect answer

CCorrect answer

CCorrect answer
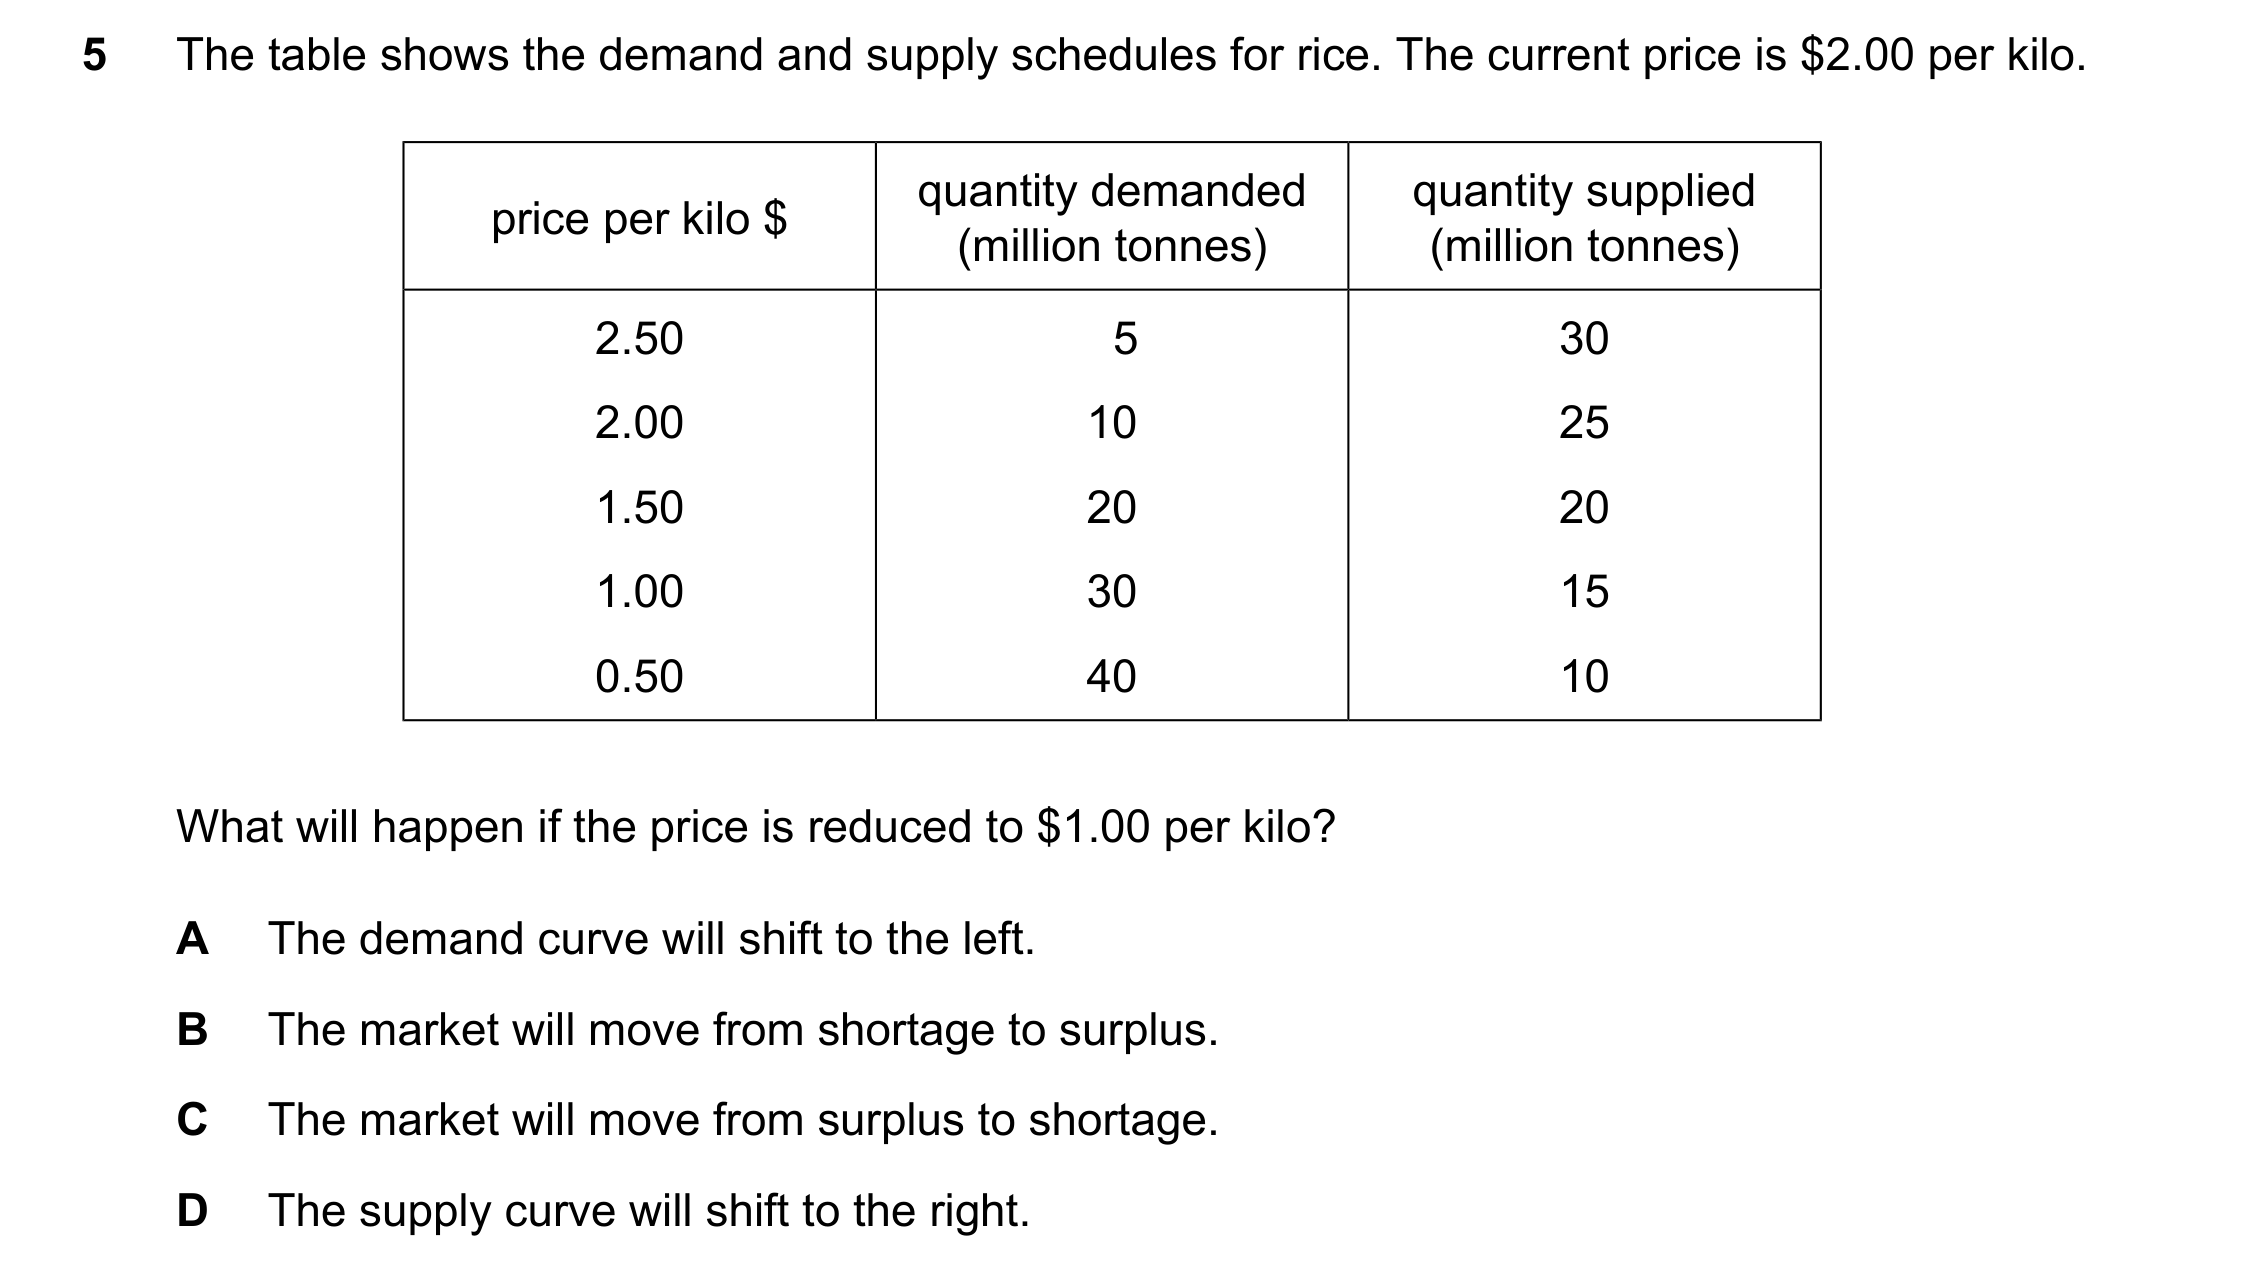
CCorrect answer
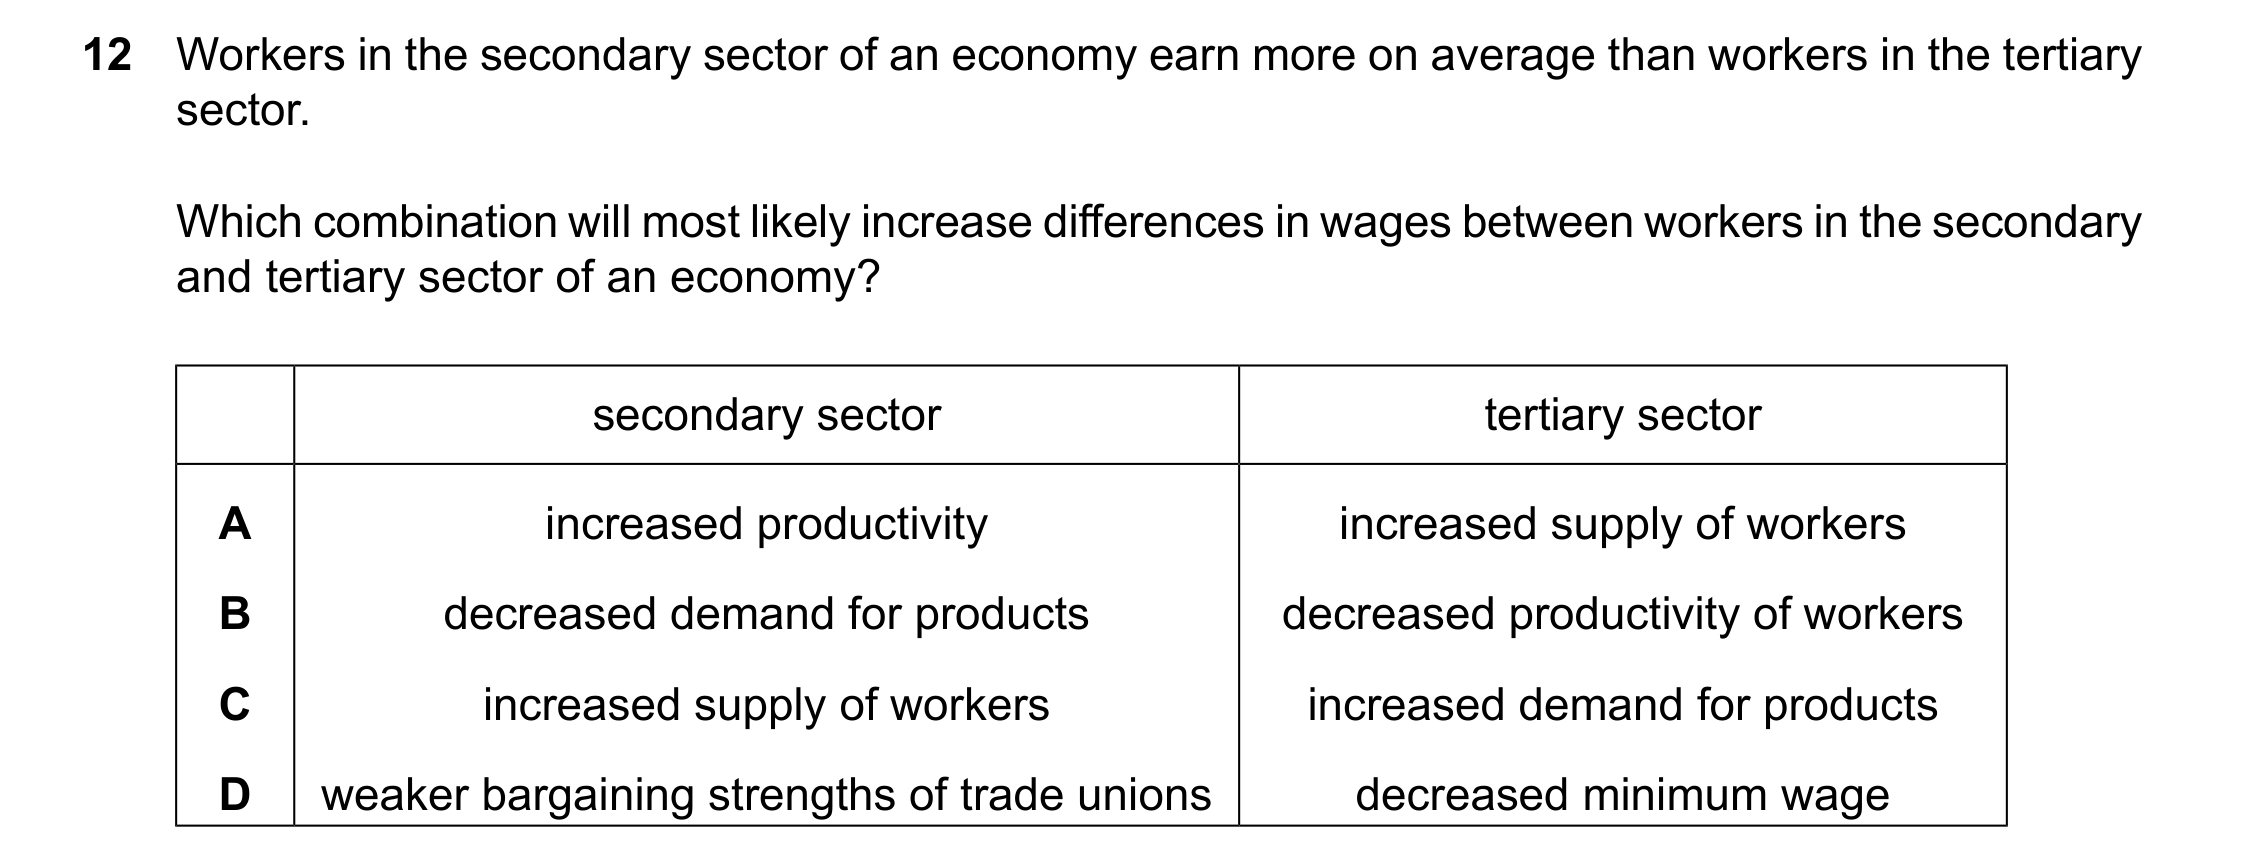
ACorrect answer
What is most likely to increase the demand for labour in an industry?
CCorrect answer
What is the most likely reason for a government to aim for price stability?
ACorrect answer

BCorrect answer

BCorrect answer

BCorrect answer
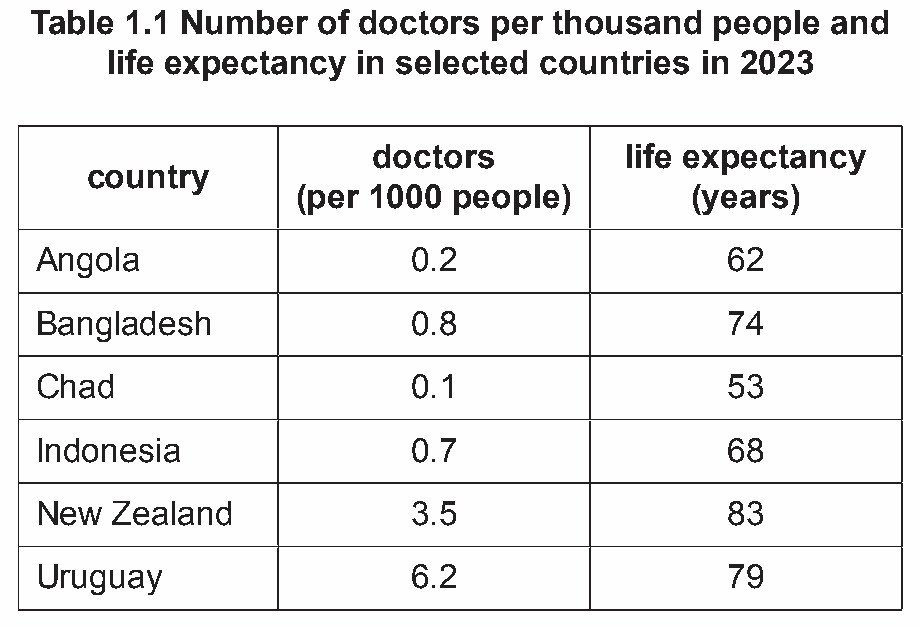
Uruguay fact file 2023 population 3.5m gross domestic product (GDP) $77.0bn government revenue $10.7bn government budget deficit $2.5bn In 2023, the Uruguayan Government raised the retirement age from 60 to 65. There are concerns about the current high government spending on pensions and it is expected that life expectancy in the country will continue to rise. A higher retirement age will have an impact on the country’s labour force, with most workers employed in the tertiary sector. The average age of Uruguay’s population is increasing due to a fall in the birth rate and emigration of young workers. Many Uruguayan workers emigrate to the United States (US) where wages are higher. However, income inequality is considerably lower in Uruguay than in the US. The tax system in Uruguay is more progressive than in the US, and the Uruguayan Government spends a higher percentage of GDP on education and healthcare. In both Uruguay and the US, there is increasing demand for swimming pools. These use a large amount of water. Demand for some luxury items, such as swimming pools, is increasing in Uruguay. Demand for healthcare is also rising which is likely to increase the number of doctors in Uruguay. Table 1.1 shows the number of doctors per thousand people and life expectancy in selected countries. Table 1.1 Number of doctors per thousand people and life expectancy in selected countries in 2023 doctors life expectancy country (per 1000 people) (years) Angola 0.2 62 Bangladesh 0.8 74 Chad 0.1 53 Indonesia 0.7 68 New Zealand 3.5 83 Uruguay 6.2 79 In 2023, Uruguay experienced its lowest inflation rate for eighteen years. This low level of inflation encouraged investment in the country. It changed the international competitiveness of the country’s products against its main trading partners, which had higher inflation rates. It also had an impact on the cost of debt in the country and firms’ willingness to increase their output. Prices change at different rates in different markets. In several markets in Uruguay, there is only one firm. All of Uruguay’s monopolies can set the price of the products they sell. Having monopoly power can also affect the firm’s average total cost and the quality of what they produce.

Draw a demand and supply diagram to show the effect of an increase in demand for swimming pools on the market for water.
Draw a demand and supply diagram to show the effect of an increase in demand for swimming pools on the market for water. Coherent analysis which might include: D&S diagram: Axes correctly labelled – price and quantity (or P and Q) (1). Original demand and supply curves correctly labelled (1). New demand curve shifted to the right and labelled (1). Equilibriums – shown by lines P1 and Q1 and P2 and Q2 or equilibrium points marked as E1 and E2 (1). Question Answer Marks Guidance
The UK Government imposes an indirect tax on a range of products. However, some goods and services do not have an indirect tax on them. These include books, children’s clothes and cakes. UK clothes firms would like the indirect tax removed from adults’ clothes. In 2023, there were some mergers between UK clothes firms. A year later, the UK Government planned to put an indirect tax on private sector school fees.
Explain two reasons why demand for cakes may increase.
Explain two reasons why demand for cakes may One mark each for each of two reasons identified and one increase. mark for each of two reasons. Logical explanation which might include: If more than two reasons are given, consider the first three.
It takes many years for an olive tree to produce olives, making their supply inelastic. However, many economies have developed due to increases in the sales of this primary-sector product. Greek olive farmers have the potential to contribute to economic development. These farmers are hoping that the government will provide more subsidies to their industry.
Analyse the causes of an increase in the sales of a product.
Analyse the causes of an increase in the sales of a product. Max 3 marks for simply listing the causes without an explanation. Coherent analysis which might include:
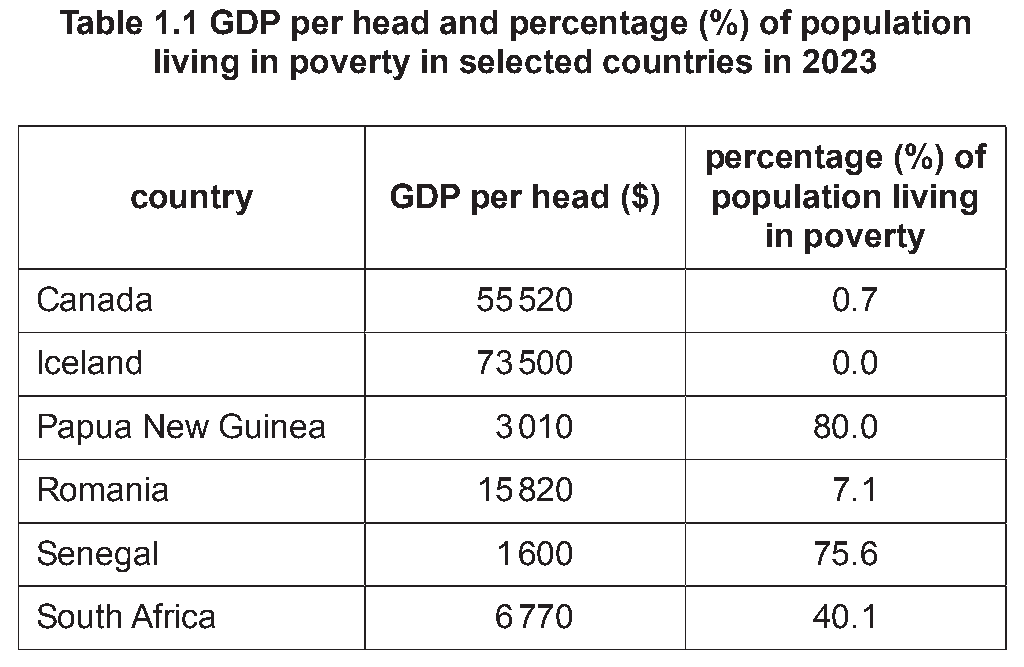
Senegal fact file 2023 population 19m gross domestic product (GDP) $31bn workers’ remittances as a percentage of GDP 9% Human Development Index (HDI) value 0.517 Senegal, a north‑east African country, has some of its workers employed in other countries. These workers send a percentage of their wages home to relatives. This money is known as workers’ remittances. Due to their relatively low incomes, most Senegalese households spend all of these remittances. However, some households do not spend all of the money they receive when interest rates are high or when confidence is low. A relatively high proportion of workers in Senegal are employed in agriculture. The crops grown in Senegal are affected by extreme heat and droughts. These weather conditions are one reason why the country grows the crop, sorghum, which does not need much water during its growth. Sorghum is low in calories and so can help people who consume it to lose weight. Senegal is a net exporter of sorghum. It is also the largest African exporter of rice after Nigeria. Greater use of capital equipment in the production of both sorghum and rice could affect productivity. This may reduce the deficit on the current account of Senegal’s balance of payments. The Senegalese Government wants to develop the country’s secondary and tertiary sectors to improve the country’s economic performance. It also expects that this will reduce poverty as measured by those living on $6.85 or less a day. Table 1.1 shows GDP per head and the percentage (%) of population living in poverty in selected countries. Table 1.1 GDP per head and percentage (%) of population living in poverty in selected countries in 2023 percentage (%) of country GDP per head ($) population living in poverty Canada 55 520 0.7 Iceland 73 500 0.0 Papua New Guinea 3 010 80.0 Romania 15 820 7.1 Senegal 1 600 75.6 South Africa 6 770 40.1 A related aim of the Senegalese Government is to increase the country’s HDI value. Governments can use fiscal policy measures to improve the three components of their HDI value, including life expectancy. Changes in fiscal policy can also affect the markets for Senegalese products including gold. Among the influences on the price elasticity of demand for gold are changes in income, the availability of substitutes and the extent to which gold is seen as a luxury.

Draw a demand and supply diagram to show how more people trying to lose weight would affect the market for sorghum.
Draw a demand and supply diagram to show how more people trying to lose weight would affect the market for sorghum. Coherent analysis which might include: D&S diagram: Axes correctly labelled – price and quantity or P and Q (1). Original demand and supply curves correctly labelled (1). New demand curve shifted to the right, with label (1). Equilibriums – shown by lines P1 and Q1 and P2 and Q2 or equilibrium points marked as E1 and E2 (1). and Q used to identify the equilibrium values then these can also be taken as proxy axis labels and awarded the first mark. Question Answer Marks Guidance
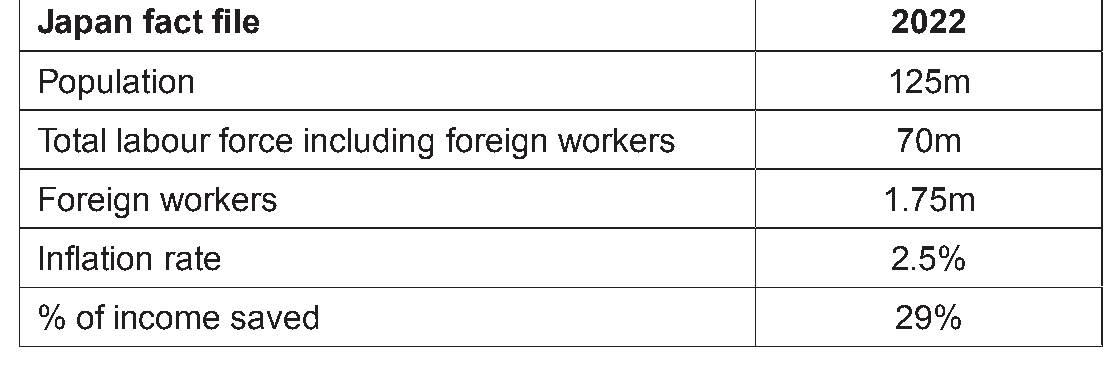
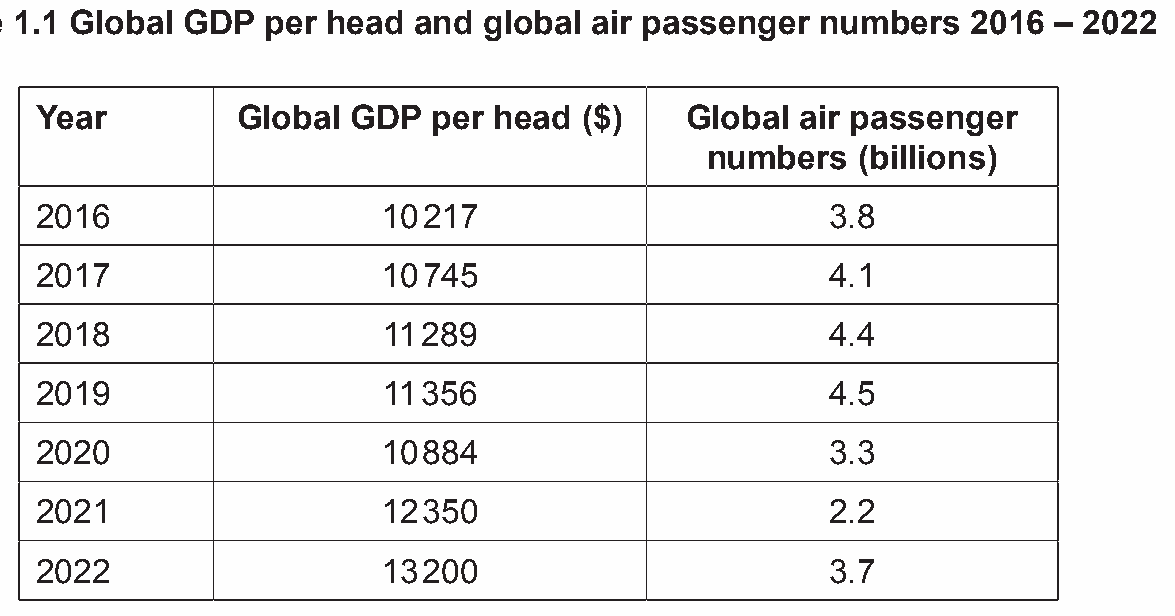
Japan fact file 2022 Population 125m Total labour force including foreign workers 70m Foreign workers 1.75m Inflation rate 2.5% % of income saved 29% Japan has a high average age of population and a varied economic performance. It has a low birth rate, low inflation rate, good healthcare, high life expectancy and low unemployment rate. Fewer Japanese people enter the labour force each year. It is predicted that Japan’s labour force will fall by 10 million by 2040. Many young Japanese people emigrate to Australia, Canada and the US in search of higher wages. However, Japan now experiences net immigration although foreign workers are currently only a small proportion of Japan’s labour force. To achieve an annual economic growth rate of 1.2%, it has been estimated that the number of foreign workers would have to increase to 7 million by 2040. Some foreign workers are discouraged from working in Japan due to the requirement to pass a Japanese language test. Only the most skilled are allowed to stay for more than 5 years and to bring their families with them. Many Japanese industries are affected by labour shortages and the country’s decline in population. For example, the fall in population has affected the quantity of furniture traded. It has also influenced the country’s air transport industry. Air travel is the most important method of transport in Japan for foreign travel and long-distance internal travel. Japan’s air passenger numbers follow a similar pattern to global air passenger numbers. Table 1.1 shows global GDP per head and global air passenger numbers between 2016 and 2022. Table 1.1 Global GDP per head and global air passenger numbers 2016 – 2022 Year Global GDP per head ($) Global air passenger numbers (billions) 2016 10 217 3.8 2017 10 745 4.1 2018 11 289 4.4 2019 11 356 4.5 2020 10 884 3.3 2021 12 350 2.2 2022 13 200 3.7 Demand for goods and services, including air travel, is influenced by how much people save. Japanese people save a relatively high proportion of their income. This has affected the country’s inflation rate, current account balance of the balance of payments and its economic growth rate. Japan’s macroeconomic performance is also influenced by the mobility of its labour force. There are several reasons why the mobility of Japan’s labour force may change in the future. These include its ageing labour force and possible changes in education and training, house prices and the quality and price of transport.
Draw a demand and supply diagram to show the effect of a decrease in population on the market for furniture.
Draw a demand and supply diagram to show the effect of a decrease in population on the market for furniture. Coherent analysis which might include the following. D&S diagram: Axes correctly labelled – price and quantity or p and q (1). Original demand and supply curves correctly labelled (1). New demand curve shifted to the left (1). OR New supply curve shifted to the left (1). OR New demand curve shifted to the left AND new supply curve shifted to the left. Equilibriums – shown by lines P1 and Q1 and P2 and Q2 or equilibrium points marked as E1 and E2 (1). Question Answer Marks Guidance
Analyse the relationship between global GDP per head and global air passenger numbers.
Analyse the relationship between global GDP per head Responses do not have to be in the format suggested but and global air passenger numbers. they should address the expected / normal relationship, offer supporting evidence of that, highlight any exceptions to that, Coherent analysis which might include the following. and analyse the overall data. Expected relationship: Supporting evidence should involve interpretation, not just Generally, a positive relationship (1) the higher the global description. GDP head, the higher the air passenger numbers (1). Supporting evidence: 2016–2019 GDP per head rose and air passenger numbers increased (1). Analysis of expected relationship: Higher GDP per head increases purchasing power / ability to pay for air travel (1) as people get richer, they travel more for leisure and business (1). Exception: 2021 (1) GDP per head rose but air passenger numbers decreased (1). Analysis of exception: May have been a time delay in people gaining confidence in flying after COVID-19 pandemic / other influences on demand e.g. air fares (1). Question Answer Marks Guidance
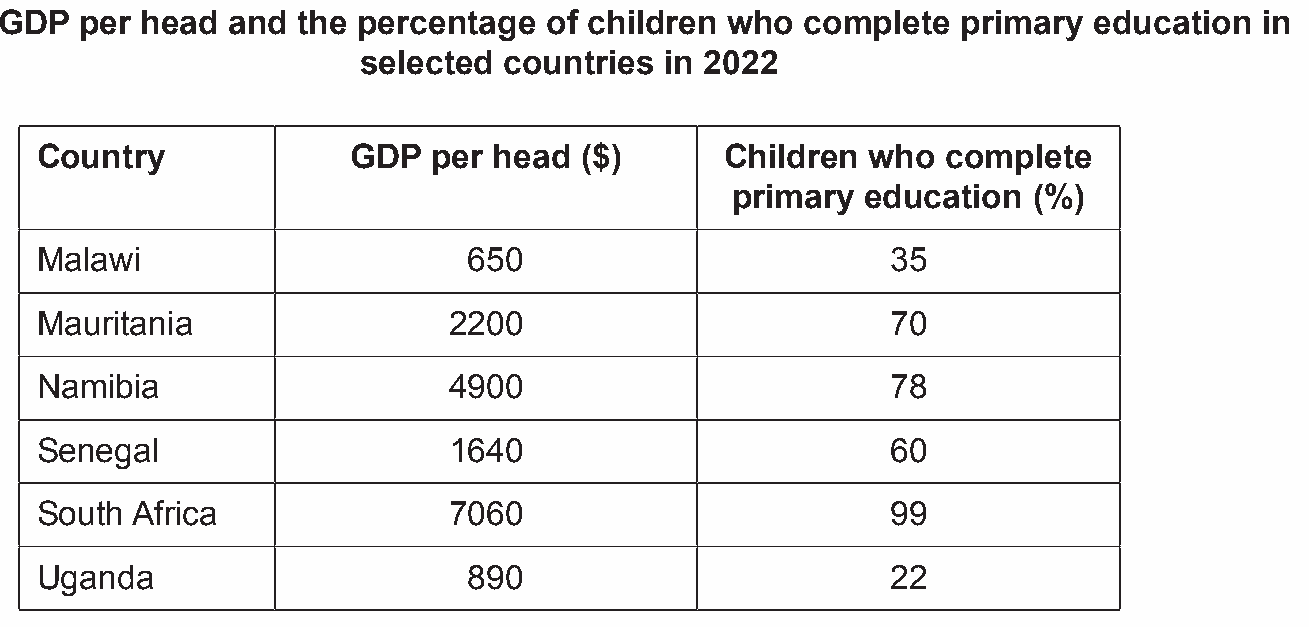
Malawi fact file 2022 Population 22m Percentage of population with access to electricity 15% Deficit on the current account of the balance of payments 12.9% of GDP Malawi is a low-income East African country. It is often affected by natural disasters including droughts, floods and storms. In January 2022, Malawi was hit by Storm Ana. This damaged agricultural crops, factories, forests and power stations. More than three-quarters of Malawi’s labour force are employed in agriculture. Two of the country’s main crops are tea and sugar. The quantity of tea offered for sale is affected by weather conditions, government subsidies and the price of fertilisers. The global market for sugar has been affected by health reports which identified the possible harmful effects of consuming too much sugar. Three of the priorities of the Malawian Government are to develop new industries, raise education standards and develop more sustainable sources of energy. The proportion of Malawian children who finish their primary education (5–11 years of age) is relatively low. Table 1.1 shows GDP per head and the percentage of children who complete primary education in selected countries in 2022. Table 1.1 GDP per head and the percentage of children who complete primary education in selected countries in 2022 Country GDP per head ($) Children who complete primary education (%) Malawi 650 35 Mauritania 2200 70 Namibia 4900 78 Senegal 1640 60 South Africa 7060 99 Uganda 890 22 Only a small proportion of Malawi’s population has access to electricity. Most households rely on wood and charcoal for cooking and heating. Using wood as a fuel contributes to the destruction of the country’s forests and reduces air quality. The country does, however, get 3000 hours of sunshine a year. This means it could develop solar energy. There would be an initial cost to install solar panels and to reduce the risk of storm damage. Solar energy plants (also known as solar farms) can take up a large area and create visual pollution. However, a successful solar energy industry could decrease Malawi’s imports of fuel and might affect its exchange rate. Malawi’s foreign exchange rate fell in 2022. The country’s currency, the kwacha, bought fewer US dollars. This depreciation affected Malawi’s current account of the balance of payment, its inflation rate and its economic growth rate. Some economists suggested that the Malawian Government should stop the kwacha falling further in value.

Draw a demand and supply diagram to show the effect of a report stating the health risks of consuming sugar on the market for sugar.
Draw a demand and supply diagram to show the effect of a report stating the health risks of consuming sugar on the market for sugar. Coherent analysis which might include the following. D&S diagram:
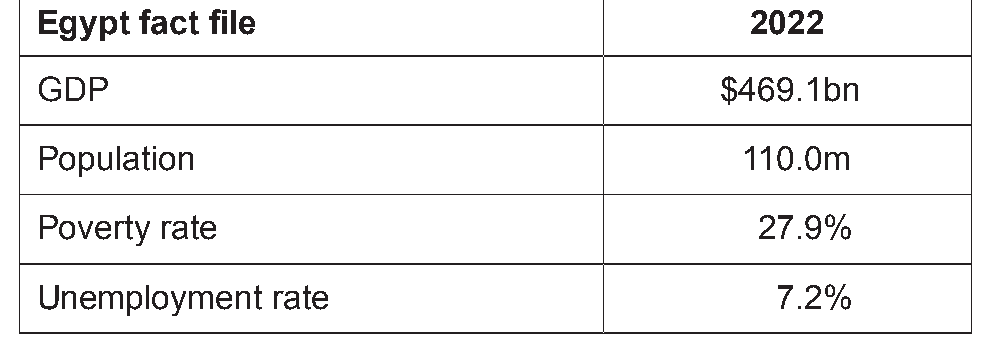
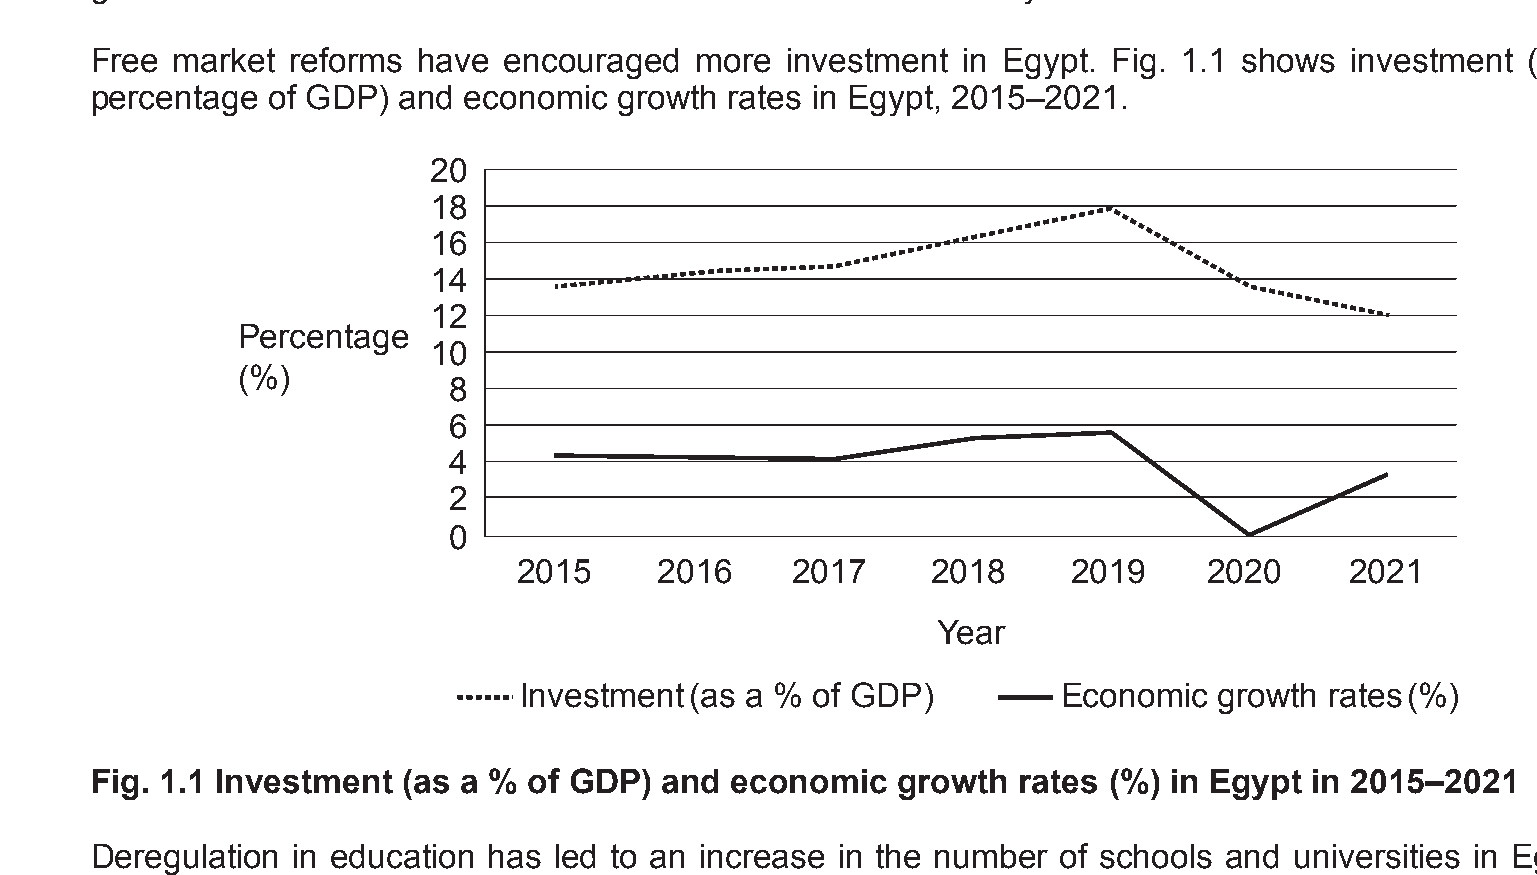
Egypt fact file 2022 GDP $469.1bn Population 110.0m Poverty rate 27.9% Unemployment rate 7.2% Egypt has always attracted tourists due to the pyramids and other ancient wonders. However, the tertiary sector is not the only source of economic growth; the primary and secondary sectors also contribute to economic growth. Egypt’s exports include personal travel, oil, citrus fruits, gold and textiles. There has been a building boom recently in Egypt. A new city is being built which requires finance, raw materials and labour. Firms are taking a big risk with this project as they are building houses before demand for them has been confirmed. If incomes fall, for example, the market for housing might be unprofitable. Tourism is a good source of economic growth for Egypt. The country has attractions that were built thousands of years ago and natural attractions such as beautiful beaches and a warm climate. It has good infrastructure and is considered a safe and secure country which also attract tourists. Free market reforms have encouraged more investment in Egypt. Fig. 1.1 shows investment (as a percentage of GDP) and economic growth rates in Egypt, 2015–2021. Percentage 10 (%) 8 2015 2016 2017 2018 2019 2020 2021 Investment (as a % of GDP) Economic growth rates (%) Fig. 1.1 Investment (as a % of GDP) and economic growth rates (%) in Egypt in 2015–2021 Deregulation in education has led to an increase in the number of schools and universities in Egypt. Increased opportunities for education and training will ensure future improvements in living standards. However, the opening of more private schools and universities might increase inequality as private education may remain unaffordable for some income groups. In 2022, the Egyptian currency halved in value against the US dollar. The fall in the value of the currency affected inflation and the purchasing power of Egyptians. However, certain industries such as tourism have benefited from this as holidays in Egypt have become more affordable for non-Egyptians.
Draw a demand and supply diagram to show the likely effect of falling incomes on the market for housing in the new city.
Draw a demand and supply diagram to show the likely effect of falling incomes on the market for housing in the new city. D&S diagram: Axes correctly labelled – price and quantity or p and q (1). Original demand and supply curves correctly labelled (1). New demand curve shifted to the left (1). Equilibriums – shown by lines P1 and Q1 and P2 and Q2 or equilibrium points marked as E1 and E2 (1).
As cities experience economic growth, the buildings in the city become taller. This is driven by an increase in the willingness and ability of consumers to live in tall buildings. Changes in the conditions of supply have also increased the number of tall buildings being constructed. However, there is a limit to the height of buildings – above a certain height, the total cost of constructing the building will exceed the total revenue generated.
Analyse factors that can increase the willingness and ability of consumers to buy a certain product.
Analyse factors that can increase the willingness and Maximum of two marks for just listing different reasons for ability of consumers to buy a certain product. increase in willingness and ability of consumers to buy a certain product. Coherent analysis which might include: Reward increase in demand only once and reward decrease
🔒 Unlock every Demand question from 2019–2024
All 167 come with their mark schemes, answers and case studies, and appear in the practice tool above once you’re signed in. It’s free.
Questions and mark schemes are from past Cambridge papers and are reproduced for revision. Topical Vault is an independent revision resource, not affiliated with or endorsed by Cambridge Assessment International Education.
Each topic opens this practice tool with only that topic’s questions, plus how often it comes up and every question on it in one list.