Question 6June 20260455/121 mark

Show answer
DCorrect answer
Cambridge 0455, Paper 1 & 2. 2,888 questions, 2019 to 2026.
Paper 1 multiple-choice questions and Paper 2 structured questions, from the original Cambridge material. Paper 2 case studies and mark schemes are reproduced as extracted text, with data tables and charts kept as cropped images rather than retyped. A question tagged under a second chapter shows that as a cross-link; it is only filed once, under its primary chapter.
Individual and market supply, the supply curve, and the conditions of supply that shift it, such as costs of production, taxes, subsidies, technology and weather.
58 past paper questions on this topic since 2019, across 26 exam sessions.
| Year | Paper 1 | Paper 2 | Total | Chart |
|---|---|---|---|---|
| 2026 | 3 | 2 | 5 | |
| 2025 | 3 | 5 | 8 | |
| 2024 | 4 | 4 | 8 | |
| 2023 | 5 | 1 | 6 | |
| 2022 | 4 | 4 | 8 | |
| 2021 | 5 | 1 | 6 | |
| 2020 | 6 | 2 | 8 | |
| 2019 | 3 | 6 | 9 |
The whole topic on one page, with answers and mark schemes. Printing this page prints just this list.
DCorrect answer

CCorrect answer

CCorrect answer
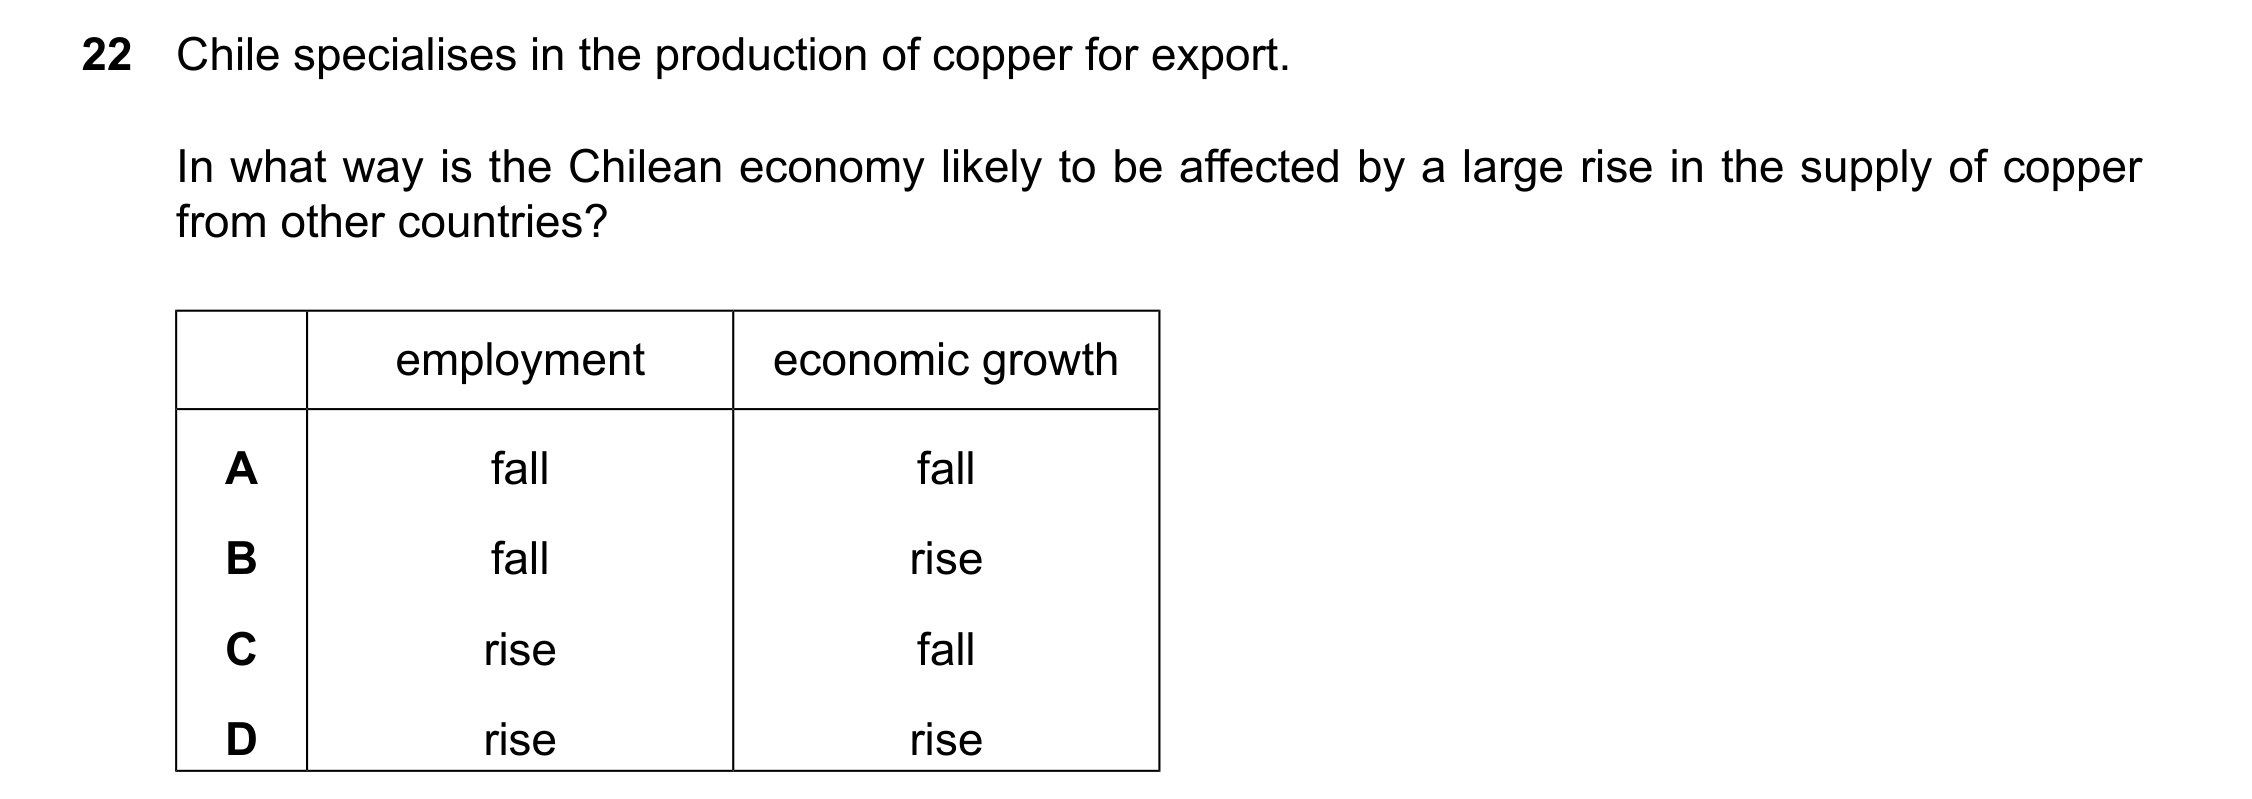
ACorrect answer

CCorrect answer
What is likely to cause deflation?
DCorrect answer
Kuwait fact file 2023 labour force 2.4m gross domestic product (GDP) $160bn surplus on the current account of $64bn the balance of payments Kuwait, a country in the Middle East, has a relatively large current account surplus. Countries, including China, India and South Korea, buy oil and electrical equipment from Kuwait. These countries’ firms also pay to have ships insured in Kuwait and for financial advice from Kuwaiti banks. Products that are exported create employment and income. However, Kuwaiti exports are then not available to be consumed in Kuwait. Kuwait is a high-income country with a relatively long life expectancy. It has good quality education and healthcare. The price of a range of products is cheaper in Kuwait than in Europe and the United States. For example, in 2023, the price of jeans and monthly access to the internet were cheaper in Kuwait. These price differences may change in the future as a result of changes in indirect taxes. In recent years, there has been an increase in the number of Kuwaiti workers employed in the country’s high-technology industries. Kuwait had a low unemployment rate in 2023, but a relatively high youth unemployment rate. Table 1.1 shows the unemployment rate and the youth unemployment rate (15 –24 year olds) in selected countries in 2023. Table 1.1 The unemployment rate and youth unemployment rate in selected countries in 2023 country unemployment rate (%) youth unemployment rate (%) Argentina 6.8 30.0 Australia 3.7 10.8 Bahamas 10.1 30.5 Eswatini 22.6 51.0 Jordan 19.2 40.5 Kuwait 2.2 25.5 The Kuwaiti Government aims to reduce youth unemployment and to encourage an increase in the proportion of workers employed in the private sector. Whether workers will move from the public sector to the private sector will depend on, for example, wages, job security and working conditions in the two sectors. Infrastructure projects in Kuwait influence employment. One example is the construction of the Mubarak Al-Kabeer port on Boubyan Island, a very popular tourist area in Kuwait. It is hoped that the port will change the cost of sea transport and create many jobs for Kuwait’s young workers. However, some are concerned that the port may create noise, water and air pollution and have an impact on the wildlife on and around the island. There is also the possibility that the land could be put to better use.


Draw a demand and supply diagram to show how an increase in the indirect tax on jeans will affect the market for jeans.
Draw a demand and supply diagram to show how an If there is no correct shift of a correct supply curve the increase in the indirect tax on jeans will affect the equilibriums mark cannot be awarded, even if the market for jeans. ‘equilibriums’ are included in the diagram. Coherent analysis which might include: D and S diagram: Axes correctly labelled – price and quantity or P and Q or P1 Q1 (1). Original demand and supply curves correctly labelled (1). New supply curve shifted to the left and labelled/correct arrow (1). Equilibriums – shown by lines P1 and Q1 and P2 and Q2 or equilibrium points marked as E1 and E2 (1). Question Answer Marks Guidance
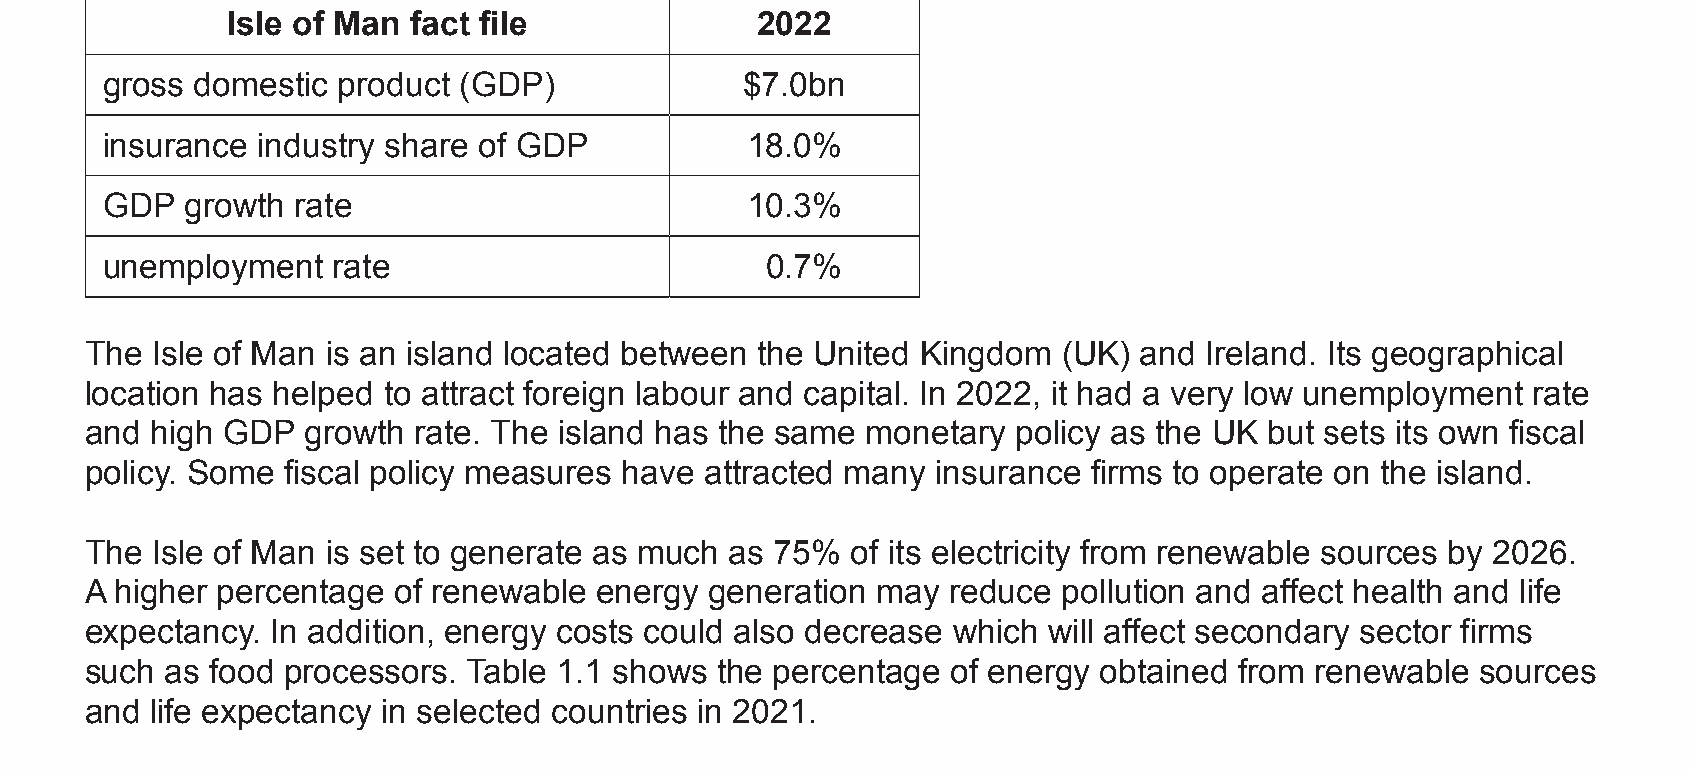
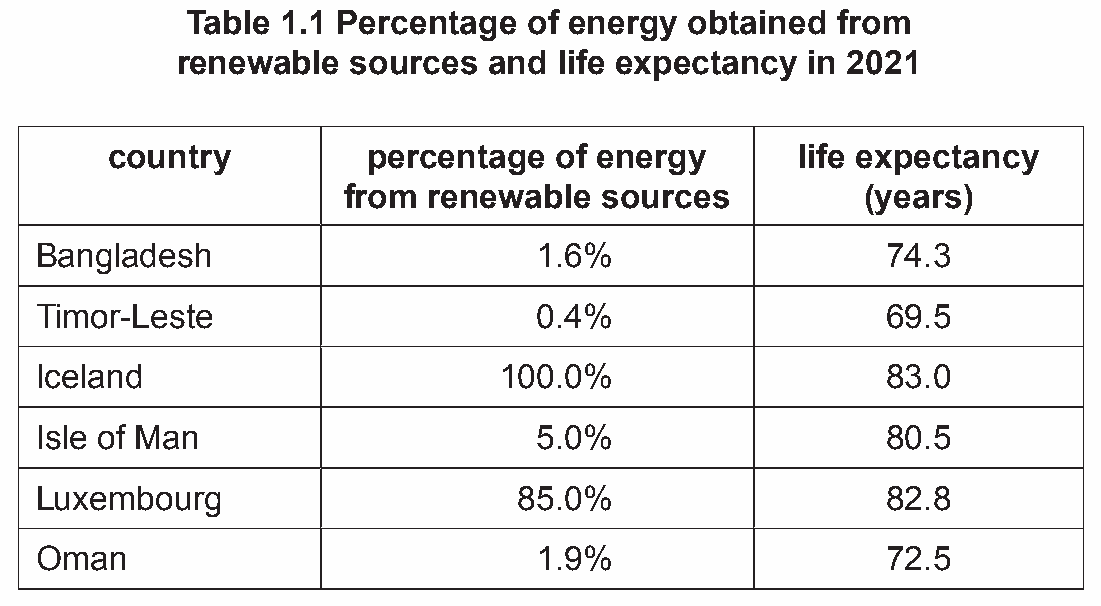
Isle of Man fact file 2022 gross domestic product (GDP) $7.0bn insurance industry share of GDP 18.0% GDP growth rate 10.3% unemployment rate 0.7% The Isle of Man is an island located between the United Kingdom (UK) and Ireland. Its geographical location has helped to attract foreign labour and capital. In 2022, it had a very low unemployment rate and high GDP growth rate. The island has the same monetary policy as the UK but sets its own fiscal policy. Some fiscal policy measures have attracted many insurance firms to operate on the island. The Isle of Man is set to generate as much as 75% of its electricity from renewable sources by 2026. A higher percentage of renewable energy generation may reduce pollution and affect health and life expectancy. In addition, energy costs could also decrease which will affect secondary sector firms such as food processors. Table 1.1 shows the percentage of energy obtained from renewable sources and life expectancy in selected countries in 2021. Table 1.1 Percentage of energy obtained from renewable sources and life expectancy in 2021 country percentage of energy life expectancy from renewable sources (years) Bangladesh 1.6% 74.3 Timor-Leste 0.4% 69.5 Iceland 100.0% 83.0 Isle of Man 5.0% 80.5 Luxembourg 85.0% 82.8 Oman 1.9% 72.5 Goods are transported to and from the island by air or sea. The government has increased spending to improve the airport and move the economy’s production possibility curve (PPC). The increased spending was used to increase the number of employees and improve the airport building. This has affected the number of flight cancellations. However, some airport users are still not satisfied. Some industries are also dissatisfied as the government is not funding projects which affect these other industries directly. Firms deciding whether to invest in the Isle of Man consider several influences including the level of demand and labour availability. The market for goods and services on the island is very small. However, there is free trade with neighbouring countries. Foreign workers are attracted by the low cost of living in the Isle of Man. However, some workers stay for only a short period of time before moving to jobs elsewhere.
Draw a demand and supply diagram to show the effect of lower energy costs on the market for processed food.
Draw a demand and supply diagram to show the effect of lower energy costs on the market for processed food. D and S diagram: Axes correctly labelled – price and quantity, or p and q (1). Original demand and supply curves correctly labelled (1). New supply curve shifted to the right (1). Equilibriums – shown by lines P1 and Q1 and P2 and Q2 or equilibrium points marked as E1 and E2 (1). Question Answer Marks Guidance
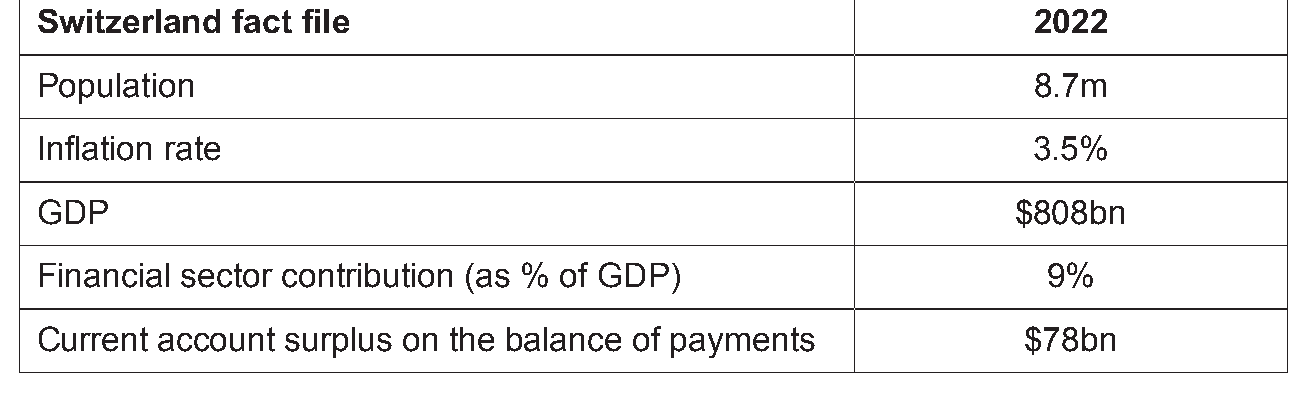
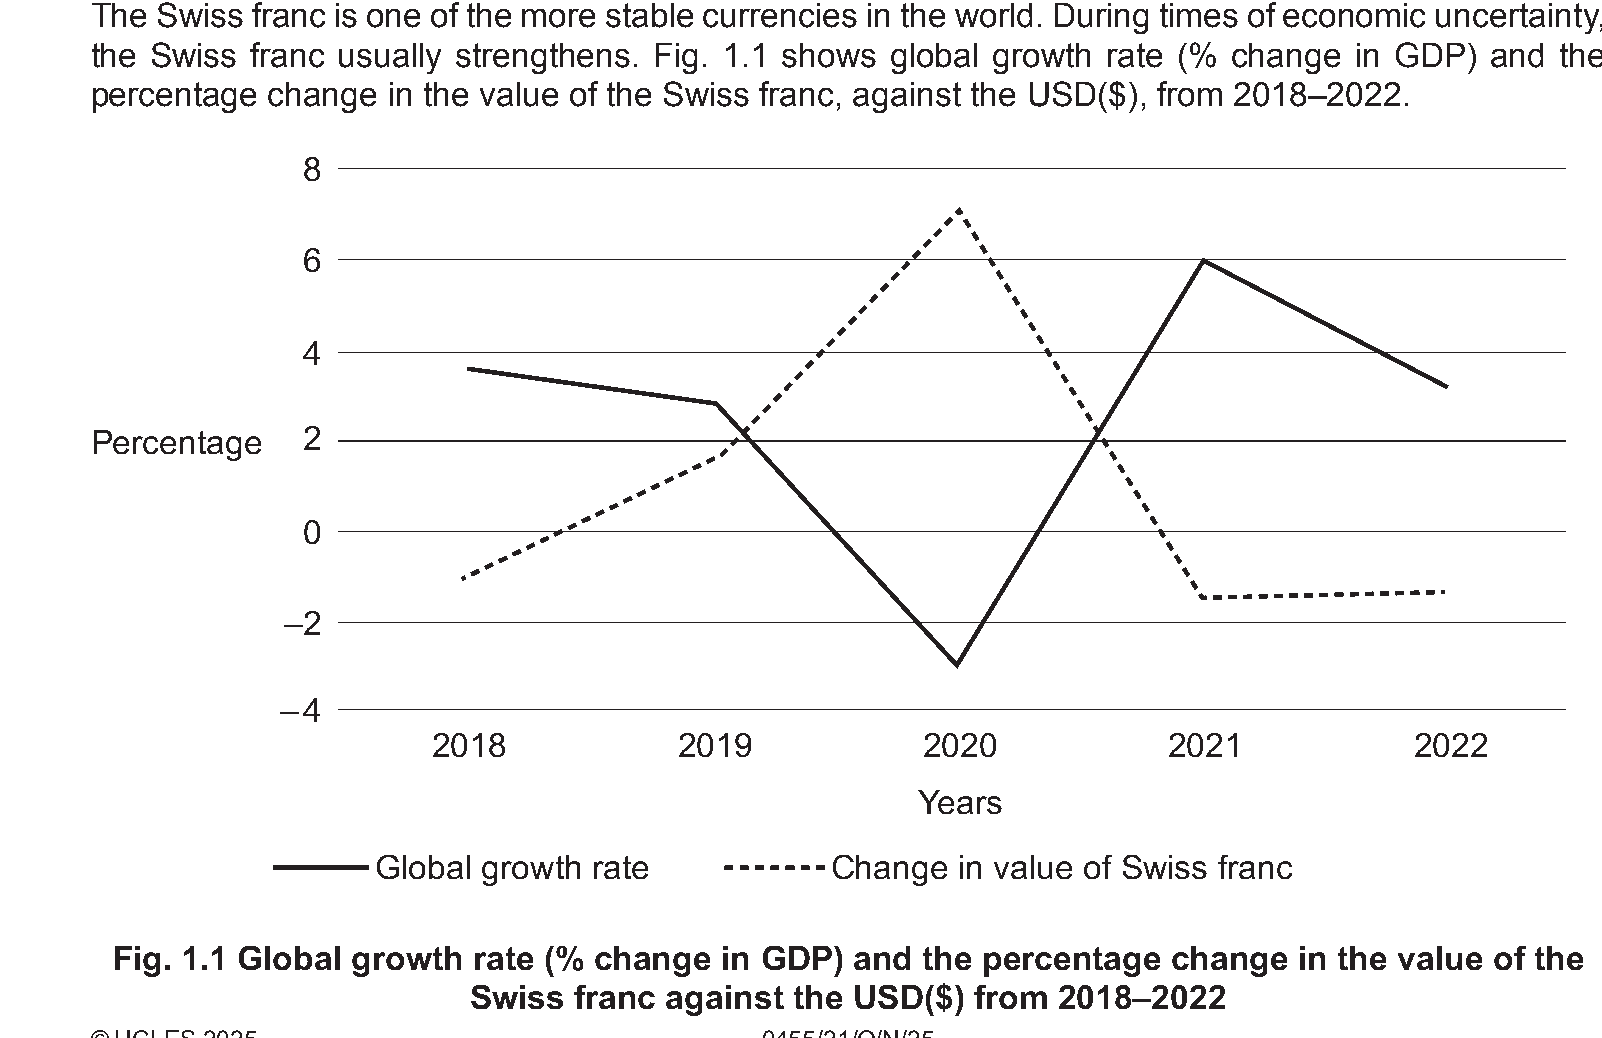
Switzerland fact file 2022 Population 8.7m Inflation rate 3.5% GDP $808bn Financial sector contribution (as % of GDP) 9% Current account surplus on the balance of payments $78bn Although inflation in Switzerland in 2022 was above its target of 2%, it was below the inflation rate of other high‑income economies, such as the US (9.1%), the UK (11.1%) and Germany (7.9%). Price levels are more stable because of a combination of microeconomic and macroeconomic policy measures. These include maximum prices, subsidies and a contractionary monetary policy. To encourage the production of solar energy, the Swiss Government has provided more than $500 million in subsidies to producers. This is part of the government’s plan to move away from non‑renewable sources of energy which are mainly imported. Overdependence on foreign markets could lead to the economy becoming more exposed to external shocks. Switzerland’s current account of the balance of payments has been in surplus from 2015 to 2022. Low inflation, along with the production of very high‑quality products, may have contributed to this surplus. A strong currency has also kept the cost of imported raw materials low in Switzerland. The Swiss franc is one of the more stable currencies in the world. During times of economic uncertainty, the Swiss franc usually strengthens. Fig. 1.1 shows global growth rate (% change in GDP) and the percentage change in the value of the Swiss franc, against the USD($), from 2018–2022. Percentage 2 –2 –4 2018 2019 2020 2021 2022 Years Global growth rate Change in value of Swiss franc Fig. 1.1 Global growth rate (% change in GDP) and the percentage change in the value of the Swiss franc against the USD($) from 2018–2022 Although inflation was not high compared to other countries, the Swiss central bank increased interest rates in 2022. This was done to reduce inflationary pressures. However, there was a risk that higher interest rates might increase unemployment. The rise in interest rates affected some firms negatively. The Swiss Government had to organise a merger between the two largest banks in Switzerland. This was to avoid one of them collapsing which would have reduced confidence in the whole banking system. A merger might also have helped the merged bank to gain greater economies of scale. However, the merger resulted in some workers losing their jobs and gave the merged bank greater monopoly power.
Draw a demand and supply diagram to show how a subsidy to solar energy producers would affect the market for solar energy.
Draw a demand and supply diagram to show how a subsidy to solar energy producers would affect the market for solar energy. D&S diagram: Axes correctly labelled – price and quantity or p and q (1). Original demand and supply curves correctly labelled (1). New supply curve shifted to the right (1). Equilibriums – shown by lines P1 and Q1 and P2 and Q2 or equilibrium points marked as E1 and E2 (1). Question Answer Marks Guidance
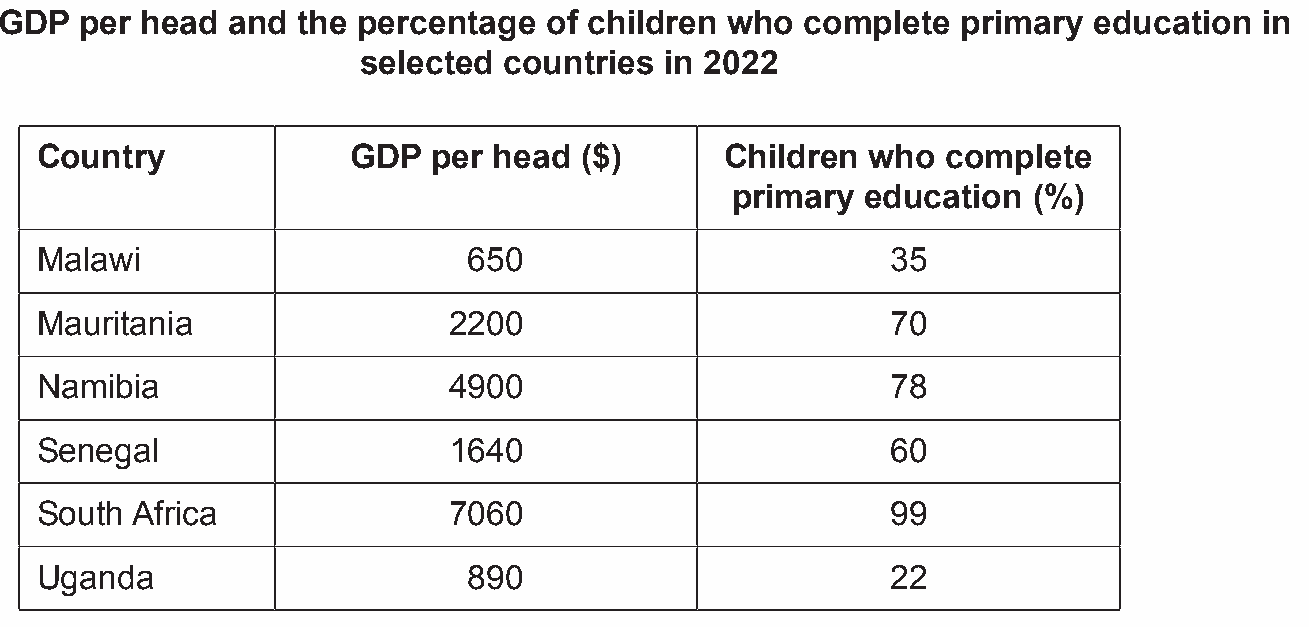
Malawi fact file 2022 Population 22m Percentage of population with access to electricity 15% Deficit on the current account of the balance of payments 12.9% of GDP Malawi is a low-income East African country. It is often affected by natural disasters including droughts, floods and storms. In January 2022, Malawi was hit by Storm Ana. This damaged agricultural crops, factories, forests and power stations. More than three-quarters of Malawi’s labour force are employed in agriculture. Two of the country’s main crops are tea and sugar. The quantity of tea offered for sale is affected by weather conditions, government subsidies and the price of fertilisers. The global market for sugar has been affected by health reports which identified the possible harmful effects of consuming too much sugar. Three of the priorities of the Malawian Government are to develop new industries, raise education standards and develop more sustainable sources of energy. The proportion of Malawian children who finish their primary education (5–11 years of age) is relatively low. Table 1.1 shows GDP per head and the percentage of children who complete primary education in selected countries in 2022. Table 1.1 GDP per head and the percentage of children who complete primary education in selected countries in 2022 Country GDP per head ($) Children who complete primary education (%) Malawi 650 35 Mauritania 2200 70 Namibia 4900 78 Senegal 1640 60 South Africa 7060 99 Uganda 890 22 Only a small proportion of Malawi’s population has access to electricity. Most households rely on wood and charcoal for cooking and heating. Using wood as a fuel contributes to the destruction of the country’s forests and reduces air quality. The country does, however, get 3000 hours of sunshine a year. This means it could develop solar energy. There would be an initial cost to install solar panels and to reduce the risk of storm damage. Solar energy plants (also known as solar farms) can take up a large area and create visual pollution. However, a successful solar energy industry could decrease Malawi’s imports of fuel and might affect its exchange rate. Malawi’s foreign exchange rate fell in 2022. The country’s currency, the kwacha, bought fewer US dollars. This depreciation affected Malawi’s current account of the balance of payment, its inflation rate and its economic growth rate. Some economists suggested that the Malawian Government should stop the kwacha falling further in value.

Explain two reasons why the supply of Malawian tea may increase.
Explain two reasons why the supply of Malawian tea One mark each for two reasons identified and one mark may increase. each for two explanations. Logical explanation which might include: If more than two reasons are given, consider the first three.
Gabon fact file 2022 GDP $22bn GDP per head $13 800 Oil output $6.6bn Unemployment rate 23.2% Youth unemployment rate 38.4% Gabon is a small West African country. Its rainforests reduce air pollution, provide wood for timber production, protect against floods and reduce soil erosion. The Gabonese Government wants to conserve the country’s rainforests. It has created some national parks which has increased tourism, affecting the current account of the balance of payments. The Gabonese Government wants to reduce the country’s reliance on timber production, oil production and agriculture. The country is Africa’s fifth-largest oil producer but its resources of oil are running out. The oil industry causes water pollution. The country has other natural resources, including gold. In 2022, new deposits of gold were found in Gabon. Gabon’s agricultural industry employs a high proportion of the country’s labour force. Fig. 1.1 shows the literacy rate and the percentage of the labour force employed in agriculture in six selected countries in 2022. 70 Sierra Leone Gabon % of labour force 50 employed in agriculture 30 Mauritania 20 Tunisia 10 South Africa 0 30 40 50 60 70 80 90 100 literacy rate (% of those aged 15 and over who can read and write) Fig.1.1 The literacy rate and the percentage of the labour force employed in agriculture in selected countries in 2022 In recent years, Gabon has experienced a high rate of unemployment among 15–24 year olds. High rates of youth unemployment can result in young people not gaining the skills and experience needed to achieve high productivity. It can also have a harmful effect on their confidence. Some governments pay private sector firms to give work experience to unemployed young people. The quality of this experience can vary. The Gabonese Government wants to develop its textile industry, encouraging firms to grow in size. The output of the industry will be affected not only by possible government support but also by its use of technology and specialisation of workers.


Draw a demand and supply diagram to show the effect of the discovery of new gold deposits on the market for gold.
Draw a demand and supply diagram to show the effect of the discovery of new gold deposits on the market for gold. Coherent analysis which might include: D&S diagram: Axes correctly labelled – price and quantity or p and q (1). Original demand and supply curves correctly labelled (1). New supply curve shifted to the right (1). Equilibriums – shown by lines P1 and Q1 and P2 and Q2 or equilibrium points marked as E1 and E2 (1). Question Answer Marks Guidance
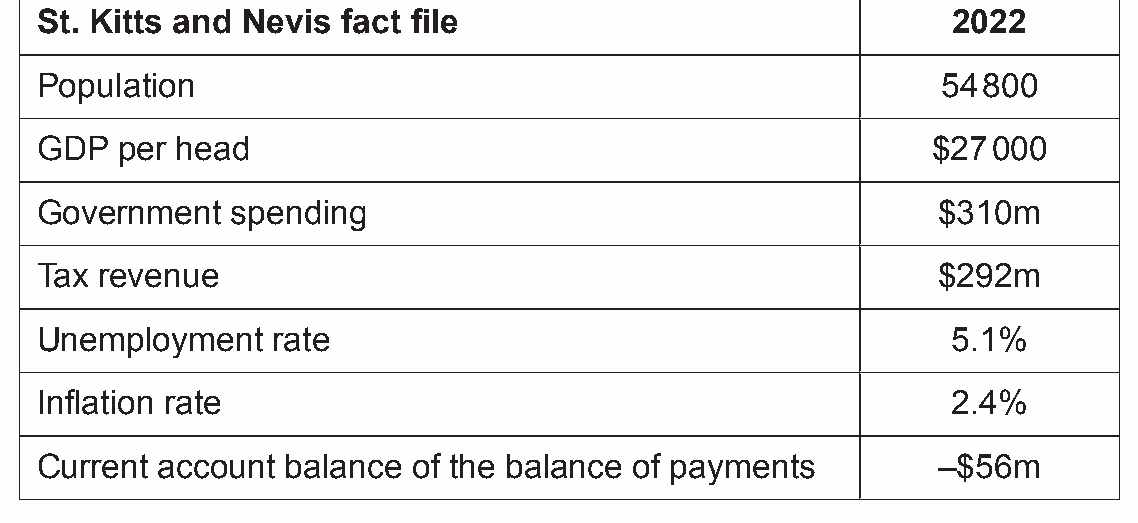
St. Kitts and Nevis fact file 2022 Population 54 800 GDP per head $27 000 Government spending $310m Tax revenue $292m Unemployment rate 5.1% Inflation rate 2.4% Current account balance of the balance of payments –$56m St. Kitts and Nevis is a small, two-island country in the Caribbean. The country’s three main industries are tourism, financial services and agriculture. Tourists are attracted by the country’s beaches, coral reefs, forts, rainforests and shipwrecks. However, if rainforests continue to be cut down and soil erosion continues to pollute the coral reefs, killing off marine life, tourism may be discouraged. The St. Kitts and Nevis Government is also concerned that the social costs of tourism exceed the private costs. St. Kitts and Nevis’s financial services include a growing banking sector. Among the country’s commercial banks are a few foreign multinational companies (MNCs). These MNCs are attracted by the country’s relatively high incomes, the absence of personal income tax and a relatively high literacy rate. Some of the country’s main agricultural products are carrots, onions, peanuts and sweet potatoes. In 2017, the St. Kitts and Nevis Government introduced a training scheme to raise the productivity of onion farmers. Other important industries in St Kitts and Nevis include healthcare and fishing. Table 1.1 shows healthcare spending as a percentage of GDP and life expectancy in six selected countries in 2022. Table 1.1 Healthcare spending as a percentage of GDP and life expectancy in selected countries in 2022 Country Healthcare spending as Life expectancy (years) a % of GDP Canada 12.9 84 Egypt 4.5 75 Haiti 3.3 65 Monaco 1.9 90 St. Kitts and Nevis 5.4 77 Sweden 11.5 83 The small size of St. Kitts and Nevis’s fishing industry means that it imports large quantities of fish. The country’s fishing boats are small and some lack up-to-date equipment. A larger fishing industry, with bigger boats, may bring a number of benefits to the country. Changes in the structure and performance of industries in St. Kitts and Nevis may alter the country’s price level. Between 2018 and 2020, the country experienced deflation. This affected people’s purchasing power, saving and debts. It also affected the country’s exports and firms’ investment decisions.

Draw a demand and supply diagram to show the effect of an increase in the productivity of onion farmers on the market for onions.
Draw a demand and supply diagram to show the effect of an increase in the productivity of onion farmers on the market for onions. D&S diagram: Axes correctly labelled – price and quantity or p and q (1). Original demand and supply curves correctly labelled (1). New supply curve shifted to the right (1). Equilibriums – shown by lines P1 and Q1 and P2 and Q2 or equilibrium points marked as E1 and E2 (1).
As cities experience economic growth, the buildings in the city become taller. This is driven by an increase in the willingness and ability of consumers to live in tall buildings. Changes in the conditions of supply have also increased the number of tall buildings being constructed. However, there is a limit to the height of buildings – above a certain height, the total cost of constructing the building will exceed the total revenue generated.
Explain two causes of an increase in the supply of a product.
Explain two causes of an increase in the supply of a One mark each for each of two reasons identified and one product. mark each for each of two explanations. Logical explanation which might include: If more than two causes given, consider the first three.
🔒 Unlock every Supply question from 2019–2024
All 45 come with their mark schemes, answers and case studies, and appear in the practice tool above once you’re signed in. It’s free.
Questions and mark schemes are from past Cambridge papers and are reproduced for revision. Topical Vault is an independent revision resource, not affiliated with or endorsed by Cambridge Assessment International Education.
Each topic opens this practice tool with only that topic’s questions, plus how often it comes up and every question on it in one list.