← Topical Vault

Differences in economic development between countries · IGCSE Economics

Cambridge 0455, Paper 1 & 2. 2,888 questions, 2019 to 2026.

Topic
Year

Paper 1 multiple-choice questions and Paper 2 structured questions, from the original Cambridge material. Paper 2 case studies and mark schemes are reproduced as extracted text, with data tables and charts kept as cropped images rather than retyped. A question tagged under a second chapter shows that as a cross-link; it is only filed once, under its primary chapter.

About Differences in economic development between countries

Differences in economic development between countries: income, productivity, population growth and the size of the primary, secondary and tertiary sectors.

37 past paper questions on this topic since 2019, across 17 exam sessions.

How often it comes up

YearPaper 1Paper 2TotalChart
2026022
2025066
2024134
2023055
2022044
2021088
2020033
2019145

Every 2025–2026 question on Differences in economic development between countries

The whole topic on one page, with answers and mark schemes. Printing this page prints just this list.

Paper 2 · Structured questions (8)

Stimulus: 0455/22

In 2023, a foreign multinational company (MNC) expanded its copper mine in Mongolia. The mine was opened ten years before when it created more than 15 000 jobs, reducing unemployment in the country. While mining increased in Mongolia, mines in some other countries were closed. Over time, the closure of mines has contributed to the decline of the primary sector in some countries. In contrast, the tertiary sector in most countries has increased.

Question 2(d)May/Jun 20260455/228 marks

Discuss whether or not a larger tertiary sector will increase a country’s economic development.

Show mark scheme

Discuss whether or not a larger tertiary sector will Level Description Marks increase a country’s economic development. 3 A reasoned discussion which accurately 6–8 In assessing each answer, use the table opposite. examines both sides of the economic argument, making use of economic Coherent discussion which might include: information and clear and logical analysis to evaluate economic issues and Why it might increase economic development: situations. One side of the argument may

  • Many highly skilled and highly paid jobs are in services have more depth than the other, but
  • may raise GDP/employment overall both sides of the argument are
  • may have good working conditions considered and developed. There is
  • may mean greater provision of education and thoughtful evaluation of economic healthcare concepts, terminology, information and/or
  • may increase HDI data appropriate to the question. The discussion may also point out the Why it might not increase economic development: possible uncertainties of alternative
  • some tertiary sector jobs e.g. in hospitality may be low decisions and outcomes. paid
  • poor working conditions in some tertiary jobs e.g. refuse 2 A reasoned discussion which makes use 3–5 collectors of economic information and clear
  • low productivity jobs can dominate (retail, hospitality, analysis to evaluate economic issues basic services) and situations. The answer may lack
  • uneven development/inequality, growth in services often some depth and development may be benefit urban areas/ those with service sector skills one-sided. There is relevant use of
  • relatively small primary sector industries that can earn economic concepts, terminology, high incomes e.g. oil information and data appropriate to the
  • relatively small secondary sector to make products/take question. more advantage of economies of scale
  • some tertiary industries may create external costs e.g. 1 There is a simple attempt at using 1–2 tourism/transport/plastics. economic definitions and terminology. Some reference may be made to economic theory, with occasional understanding. Question Answer Marks Guidance 2(d) Level Description Marks 0 A mark of zero should be awarded for no 0 creditable content. Question Answer Marks Guidance

Stimulus: 0455/23

It takes many years for an olive tree to produce olives, making their supply inelastic. However, many economies have developed due to increases in the sales of this primary-sector product. Greek olive farmers have the potential to contribute to economic development. These farmers are hoping that the government will provide more subsidies to their industry.

Question 3(b)May/Jun 20260455/234 marks

Explain how growth in the primary sector can help economic development.

Show mark scheme

Explain how growth in the primary sector can help economic development. Logical explanation which might include:

  • growth of the primary sector may provide more jobs (1) Credit a particular outcome e.g. life expectancy, economic e.g. in rural areas / coastal communities (1) increasing growth or HDI only once. incomes /living standards (1)
  • increased output in primary products may reduce their prices (1) increasing demand for the products / economic growth (1)
  • growth of the primary sector may increase the supply of raw materials (1) reducing their prices (1) increasing output in secondary industries (1)
  • may increase tax revenue (1) allows more government spending on e.g. education / healthcare (1) improving years of schooling / life expectancy (1)
  • may increase products for export (1) reduce imports of raw materials (1) increasing total demand / economic growth (1)
  • may produce more food (1) increasing life expectancy (1) improving the HDI (1) Question Answer Marks Guidance
Stimulus: 0455/21

In the first half of 2022, Guyana’s GDP grew by 36.4%. Most of this growth was due to higher output in the primary sector. The government used some of the tax revenue generated from this growth to fund long‑run development projects such as infrastructure and education. However, in the short run, there was a rise in house prices.

Question 2(d)Oct/Nov 20250455/218 marks

Discuss whether or not increased government spending on education will lead to economic development.

Show mark scheme

Why it might not: Level Description Marks

  • takes a long time to have an impact on the economy 1 There is a simple attempt at using 1–2
  • financial cost of government spending e.g. taxation / economic definitions and borrowing terminology. Some reference may be
  • opportunity cost e.g. health spending made to economic theory, with
  • reduced benefit to the economy if there is emigration of occasional understanding. skilled workers / net migration is negative 0 A mark of zero should be awarded 0
  • government might spend the money inefficiently for no creditable content.
  • education programmes may be ineffective. Question Answer Marks Guidance
Case study: Changes in the Malawian economy

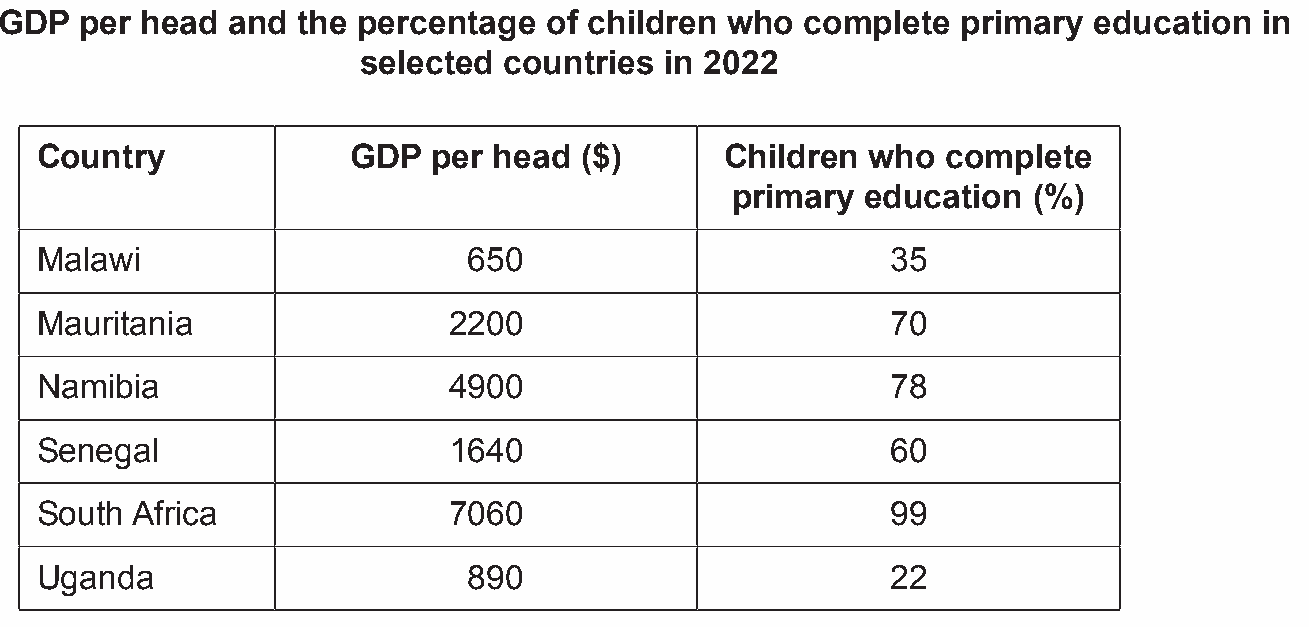
Malawi fact file 2022 Population 22m Percentage of population with access to electricity 15% Deficit on the current account of the balance of payments 12.9% of GDP Malawi is a low-income East African country. It is often affected by natural disasters including droughts, floods and storms. In January 2022, Malawi was hit by Storm Ana. This damaged agricultural crops, factories, forests and power stations. More than three-quarters of Malawi’s labour force are employed in agriculture. Two of the country’s main crops are tea and sugar. The quantity of tea offered for sale is affected by weather conditions, government subsidies and the price of fertilisers. The global market for sugar has been affected by health reports which identified the possible harmful effects of consuming too much sugar. Three of the priorities of the Malawian Government are to develop new industries, raise education standards and develop more sustainable sources of energy. The proportion of Malawian children who finish their primary education (5–11 years of age) is relatively low. Table 1.1 shows GDP per head and the percentage of children who complete primary education in selected countries in 2022. Table 1.1 GDP per head and the percentage of children who complete primary education in selected countries in 2022 Country GDP per head ($) Children who complete primary education (%) Malawi 650 35 Mauritania 2200 70 Namibia 4900 78 Senegal 1640 60 South Africa 7060 99 Uganda 890 22 Only a small proportion of Malawi’s population has access to electricity. Most households rely on wood and charcoal for cooking and heating. Using wood as a fuel contributes to the destruction of the country’s forests and reduces air quality. The country does, however, get 3000 hours of sunshine a year. This means it could develop solar energy. There would be an initial cost to install solar panels and to reduce the risk of storm damage. Solar energy plants (also known as solar farms) can take up a large area and create visual pollution. However, a successful solar energy industry could decrease Malawi’s imports of fuel and might affect its exchange rate. Malawi’s foreign exchange rate fell in 2022. The country’s currency, the kwacha, bought fewer US dollars. This depreciation affected Malawi’s current account of the balance of payment, its inflation rate and its economic growth rate. Some economists suggested that the Malawian Government should stop the kwacha falling further in value.

Malawi fact file 2022
Table 1.1 GDP per head and the percentage of children who complete primary educa
Question 1(a)Oct/Nov 20250455/231 mark

Calculate the number of Malawians who had access to electricity in 2022.

Show mark scheme

Calculate the number of Malawians who had access to Accept 3.3  106. electricity in 2022. 3.3 m or 3 300 000.

Question 1(f)Oct/Nov 20250455/235 marks

Analyse the relationship between GDP per head and the percentage of children who complete primary education.

Show mark scheme

Supporting evidence: Four countries with the highest GDP per head had the highest percentage of children who complete primary education / Malawi / Uganda have the lowest of both (1). South Africa had the highest GDP per head and the highest percentage of children who complete primary education (1). Comparison of two countries (e.g. Namibia and Senegal where GDP falls as does percentage of children completing primary education). Analysis of the expected relationship: Parents in countries with high incomes are more likely to be able to afford to keep their children in primary education (1). Government tax revenue is likely to be higher in countries with high incomes and so will be able to spend more on primary education (1). Completing primary education may increase the chance of skilled / occupationally mobile high income earning workers (1). Exception: Malawi / Uganda (1) Malawi has a lower GDP per head but a higher percentage of children who complete primary education than Uganda (1). Analysis of exception: A higher percentage of children may complete primary education but the quality of the education may be low leading to a low GDP per head / GDP per head may be high but there may be a high degree of inequality with a relatively high proportion of the population unable to keep their children in primary education (1). Question Answer Marks Guidance

Case study: Gabon’s industries and labour force

Gabon fact file 2022 GDP $22bn GDP per head $13 800 Oil output $6.6bn Unemployment rate 23.2% Youth unemployment rate 38.4% Gabon is a small West African country. Its rainforests reduce air pollution, provide wood for timber production, protect against floods and reduce soil erosion. The Gabonese Government wants to conserve the country’s rainforests. It has created some national parks which has increased tourism, affecting the current account of the balance of payments. The Gabonese Government wants to reduce the country’s reliance on timber production, oil production and agriculture. The country is Africa’s fifth-largest oil producer but its resources of oil are running out. The oil industry causes water pollution. The country has other natural resources, including gold. In 2022, new deposits of gold were found in Gabon. Gabon’s agricultural industry employs a high proportion of the country’s labour force. Fig. 1.1 shows the literacy rate and the percentage of the labour force employed in agriculture in six selected countries in 2022. 70 Sierra Leone Gabon % of labour force 50 employed in agriculture 30 Mauritania 20 Tunisia 10 South Africa 0 30 40 50 60 70 80 90 100 literacy rate (% of those aged 15 and over who can read and write) Fig.1.1 The literacy rate and the percentage of the labour force employed in agriculture in selected countries in 2022 In recent years, Gabon has experienced a high rate of unemployment among 15–24 year olds. High rates of youth unemployment can result in young people not gaining the skills and experience needed to achieve high productivity. It can also have a harmful effect on their confidence. Some governments pay private sector firms to give work experience to unemployed young people. The quality of this experience can vary. The Gabonese Government wants to develop its textile industry, encouraging firms to grow in size. The output of the industry will be affected not only by possible government support but also by its use of technology and specialisation of workers.

Gabon fact file 2022
Fig.1.1 The literacy rate and the percentage of the labour force employed in agr
Question 1(d)May/Jun 20250455/214 marks

Explain two reasons why the Gabonese Government wants to reduce reliance on oil.

Show mark scheme

Explain two reasons why the Gabonese Government One mark each for each of two reasons identified and one wants to reduce reliance on oil. mark each for each of two explanations. Logical explanation which might include: Only these two reasons are acceptable.

  • Running out of oil / create a shortage (1) revenue from the industry will decline / employment in the industry will decline / GDP will decline /cause recession / conserve for future generations / may need to import oil / price for oil may rise (1).
  • Oil industry creates water pollution / pollution (1) an external cost / harms health / reduces standard of living / protect the environment / attract tourists (1). Question Answer Marks Guidance
Question 1(f)May/Jun 20250455/215 marks

Analyse the relationship between the literacy rate and the percentage of the labour force employed in agriculture.

Show mark scheme

Analyse the relationship between the literacy rate and Responses do not have to be in the format suggested but the percentage of the labour force employed in they should address the expected/normal relationship, offer agriculture. supporting evidence of that, highlight any exceptions to that, and analyse the overall data. Coherent analysis which might include: Supporting evidence should involve interpretation, not just Expected relationship: description. Simply stating percentages without analysis of

  • Generally, an inverse / negative relationship (1) the being high or low gets no marks. higher the literacy rate, the smaller the % of the labour force employed in agriculture (1). Accept as analysis where two countries with different levels of adult literacy and percentage employed in agriculture are Supporting evidence: directly compared.
  • South Africa had the highest literacy rate and the lowest % of the labour force employed in agriculture (1).
  • Zambia / Sierra Leone / Mali had the lowest literacy rates and the highest %s of labour force employed in agriculture (1). Analysis of expected relationship:
  • A high literacy rate may increase the chance of workers gaining jobs in high paid tertiary jobs (1) a low literacy rate may mean workers have to undertake unskilled jobs in agriculture / a high proportion of workers employed in agriculture may mean that high literacy rate is not required (1). Exception:
  • Gabon (1) Gabon has a high literacy rate but also a high % of the labour force employed in agriculture (1). Analysis of exception:
  • Some jobs in agriculture are skilled / secondary and tertiary sectors may be small (1). Question Answer Marks Guidance
Stimulus: 0455/23

The public sector in Andorra is focusing on developing the healthcare, biotechnology and sports industries. Andorra has the natural advantage of being a mountainous country. Several winter sports firms in Andorra have recently merged. This will affect the level of competition in the winter sports market in Andorra.

Question 3(c)May/Jun 20250455/236 marks

Analyse how differences in healthcare can lead to differences in economic development between countries.

Show mark scheme

Analyse how differences in healthcare can lead to The question can be analysed from either poorer or better differences in economic development between healthcare provision in one country compared with another countries. but the same point should not be rewarded twice. Coherent analysis which might include: If healthcare is better in one country than another, workers will be healthier / take less time off sick (1) the productivity of labour may be higher (1) leading to higher incomes of workers (1) improved standard of living (for workers) (1) longer life expectancy / lower death rate (1) higher HDI (1). Firms may gain higher profits (1) due to lower average cost / higher revenue (1) higher quality output (1) productivity capacity of the economy will increase (1) leading to economic growth (1) exports may increase due to higher competitiveness (1) investment may increase (1) creating more jobs (1) reducing unemployment (1) increasing incomes and reducing (child) poverty (1) may increase spending on education (1).

29 more questions from 2019–2024

🔒 Unlock every Differences in economic development between countries question from 2019–2024

All 29 come with their mark schemes, answers and case studies, and appear in the practice tool above once you’re signed in. It’s free.

Create a free accountSign in

A few of them

  • 0455/21 · Oct/Nov 2024 · Question 1(g)Discuss whether or not luxury tourism and… 🔒
  • 0455/23 · Oct/Nov 2024 · Question 4(c)Analyse the causes of differences in economic… 🔒
  • 0455/12 · May/June 2024 · Question 25Economic development in country X has progressed… 🔒
  • 0455/21 · May/Jun 2024 · Question 1(e)Analyse the relationship between the percentage of… 🔒
  • 0455/21 · Oct/Nov 2023 · Question 1(f)Analyse the relationship between the percentage of… 🔒
  • + 24 more, by year in the table above

Questions and mark schemes are from past Cambridge papers and are reproduced for revision. Topical Vault is an independent revision resource, not affiliated with or endorsed by Cambridge Assessment International Education.

IGCSE Economics questions by topic

Each topic opens this practice tool with only that topic’s questions, plus how often it comes up and every question on it in one list.

  1. Ch 1The nature of the economic problem
  2. Ch 2Factors of production
  3. Ch 3Opportunity cost
  4. Ch 4Production possibility curves
  5. Ch 5Microeconomics and macroeconomics
  6. Ch 6The role of markets in allocating resources
  7. Ch 7Demand
  8. Ch 8Supply
  9. Ch 9Price determination
  10. Ch 10Price changes
  11. Ch 11Price elasticity of demand
  12. Ch 12Price elasticity of supply
  13. Ch 13Market economic system
  14. Ch 14Market failure
  15. Ch 15Mixed economic system
  16. Ch 16Money and banking
  17. Ch 17Households
  18. Ch 18Workers
  19. Ch 19Trade unions
  20. Ch 20Firms
  21. Ch 21Firms and production
  22. Ch 22Firms, costs, revenue and objectives
  23. Ch 23Market structure
  24. Ch 24The role of government
  25. Ch 25The macroeconomic aims of government
  26. Ch 26Fiscal policy
  27. Ch 27Monetary policy
  28. Ch 28Supply-side policies
  29. Ch 29Economic growth
  30. Ch 30Employment and unemployment
  31. Ch 31Inflation and deflation
  32. Ch 32Living standards
  33. Ch 33Poverty
  34. Ch 34Population
  35. Ch 35Differences in economic development between countries
  36. Ch 36International specialisation
  37. Ch 37Free trade and protection
  38. Ch 38Foreign exchange rates
  39. Ch 39Current account of balance of payments