Cambridge 9609, Paper 3 & 4. 330 questions, 2020 to 2026.
Topic
Year
Case studies and questions retyped from the original Cambridge material; Paper 3 mark
schemes are cropped from the official mark scheme PDFs, Paper 4 mark schemes are retyped as text.
A few 2020–2022 Paper 3 case studies were recovered by OCR from a damaged source file —
those are marked where it applies.
About Marketing analysis
Questions on marketing analysis: calculating and using price, income, cross and promotional elasticity, sales forecasting with moving averages and seasonal variation, and new product development and R&D.
23 past paper questions on this topic since 2020, across 14 exam sessions.
How often it comes up
Year
Paper 3
Total
Chart
2026
3
3
2025
5
5
2024
6
6
2023
4
4
2022
2
2
2021
1
1
2020
2
2
Every 2025–2026 question on Marketing analysis
The whole topic on one page, with answers and mark schemes. Printing this page prints just this list.
Paper 3 · Business decision-making (case study) (8)
Case study: Sugar-Less Scoops (SLS)
SLS was set up in country A in 2024 by Cali and Faiza as a private limited company. Cali and Faiza own 52% of the shares and two venture capitalists own 48% of the shares. Cali and Faiza identified a market for an alternative to high-sugar ice cream demanded by health-conscious consumers.
SLS manufactures zero-sugar ice creams. Its unique selling point (USP) is the distinctive flavours of its zero-sugar ice creams. SLS’s ice cream retails for a higher price than its competitors. SLS has a mission statement of ‘bringing quality to the zero-sugar ice cream market’.
Initial market research
Cali and Faiza invested a significant proportion of their start-up finance in market research. The research showed:
sales within the global zero-sugar ice cream market are forecast to increase by 15% per year until 2030.
48% of people asked said they would consider switching to a zero-sugar ice cream brand.
65% of people asked wanted a wide selection of flavours and carton sizes.
SLS decided to manufacture 10 flavours of zero-sugar ice cream in individual and share size cartons using packaging that is 100% recyclable. SLS is proud to only use the best natural ingredients. SLS started selling its products in a selection of premium supermarkets in country A.
The market and marketing
The zero-sugar ice cream market is supported by the government of country A who are concerned about health problems within the country. The government has identified diets high in sugar as one of the leading causes of these health problems. This has increased the demand for zero-sugar ice cream.
There are high levels of competition in the zero-sugar ice cream market within country A, with many new businesses offering similar products. There are currently five large businesses which control 60% of this market. The remaining 40% of the market is made up of many small businesses. SLS has developed a strong brand through social media marketing and free trials at some supermarkets. SLS has a 5% market share in country A.
The average monthly income in country A has increased from $500 to $510. This has resulted in the market for zero-sugar ice cream in country A increasing by 4%. However, SLS’s sales to retailers have increased by 8%. There have been no other changes.
Cali wants to increase profitability by increasing the price of each individual carton from $3.50 to $4.00. Faiza’s research has shown that this will result in a reduction of 20% in the quantity demanded.
Plans for expansion
Market research carried out by Cali and Faiza on country Z has identified the country as an excellent manufacturing base as well as a potential new market. Country Z is located a long distance away from country A. There is limited recognition of the SLS brand in country Z. To expand into country Z, SLS will need long-term borrowing of $3 million to open a factory and a regional office. Table 1.1 contains further financial information for SLS.
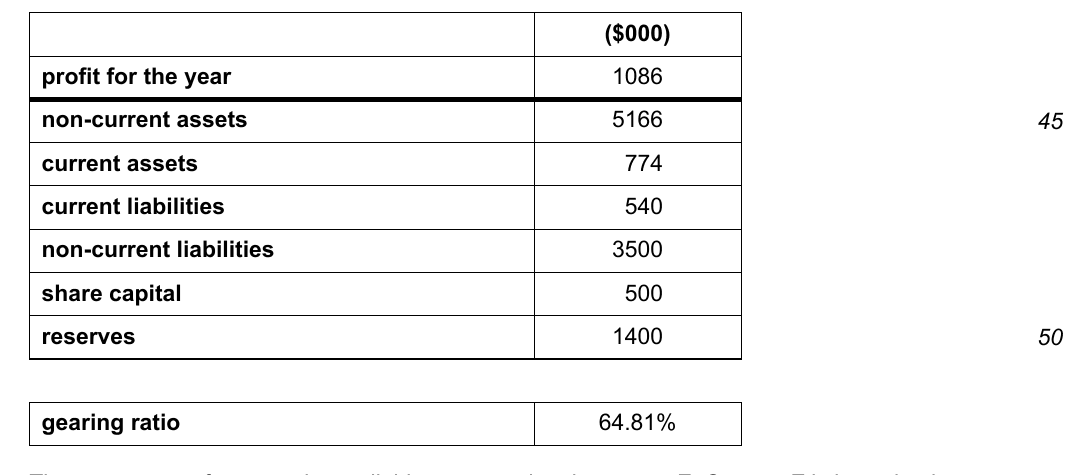
Table 1.1 Financial information 30th April 2026
There are empty factory units available to rent or buy in country Z. Country Z is investing in infrastructure for high speed WIFI and an improvement to the road system.
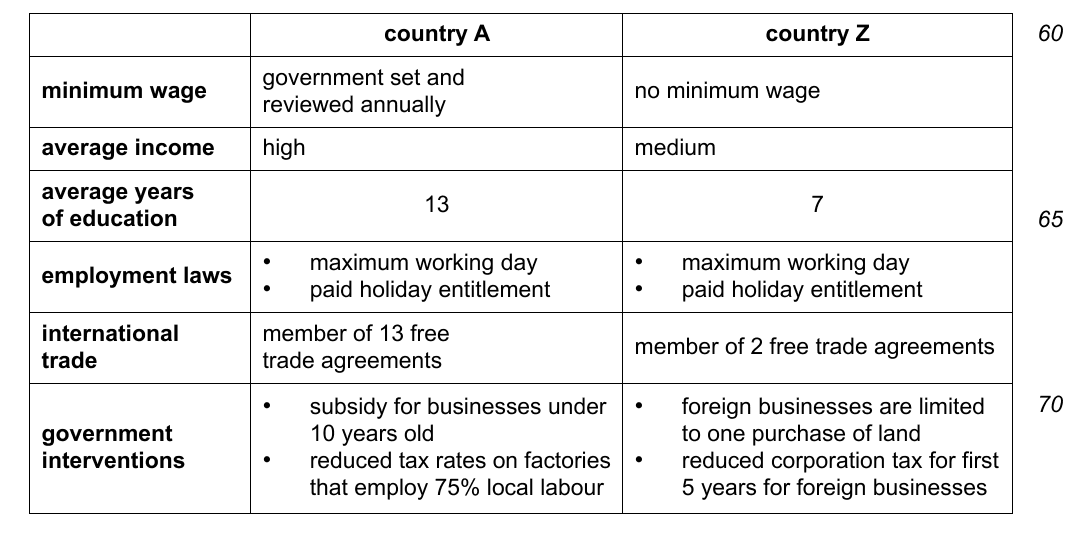
There are differences between country A and country Z, see Table 1.2. There are also social and demographic differences between consumers in the two countries. Cali and Faiza think that passing power to a regional office in country Z would be the most effective way of SLS responding to these differences. The new regional office would have responsibility for production, distribution and marketing of SLS’s ice cream in country Z.
Table 1.2 Comparison of country A and country Z
Question 3May/Jun 20269609/3116 marks
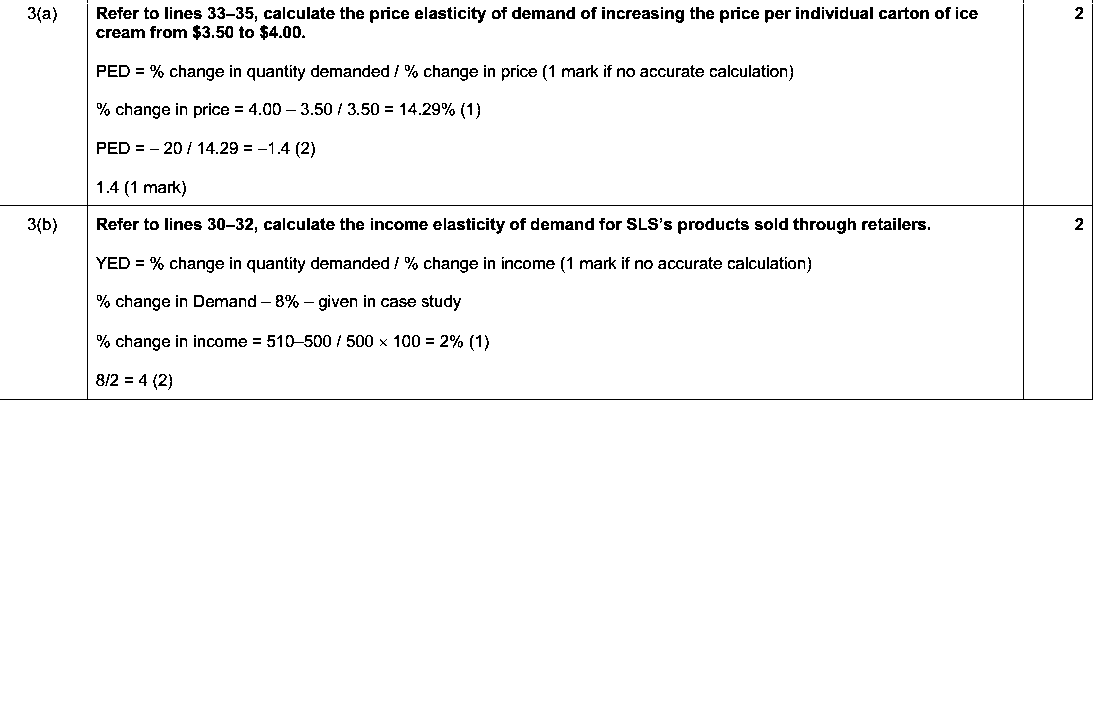
(a) Refer to lines 33–35, calculate the price elasticity of demand of increasing the price per individual carton of ice cream from $3.50 to $4.00. PED = % change in quantity demanded / % change in price ( if no accurate calculation) %. [2 marks]
(b) Refer to lines 30–32, calculate the income elasticity of demand for SLS’s products sold through retailers. YED = % change in quantity demanded / % change in income ( if no accurate calculation) % change in Demand – 8% – given in case study %. [2 marks]
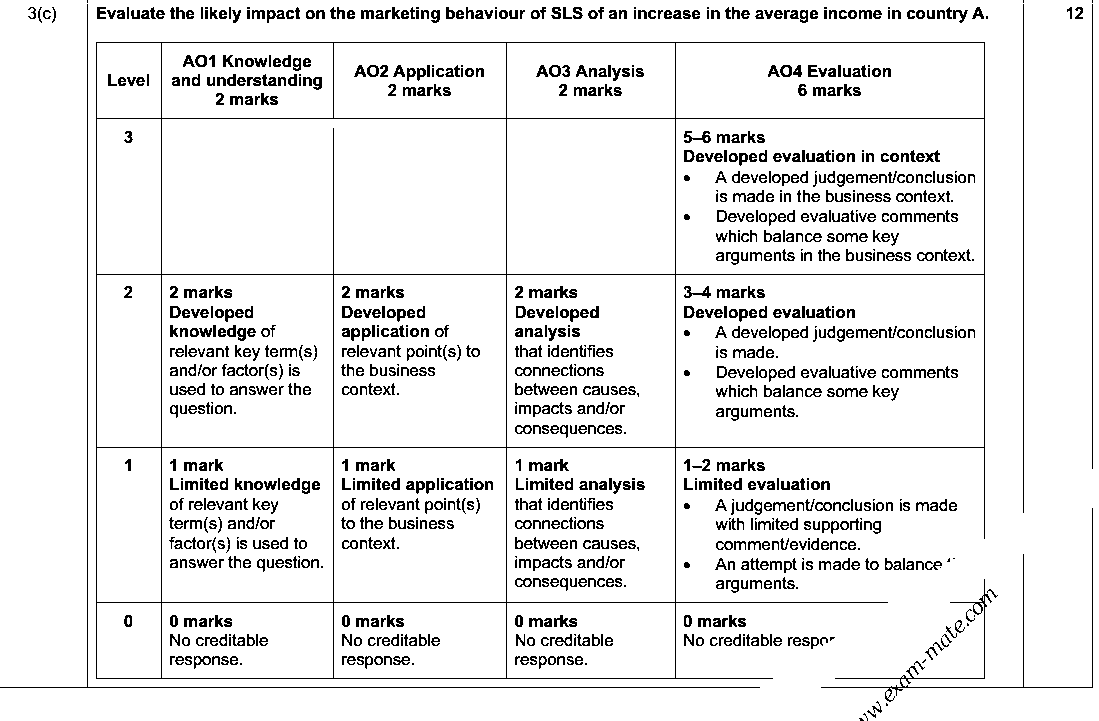
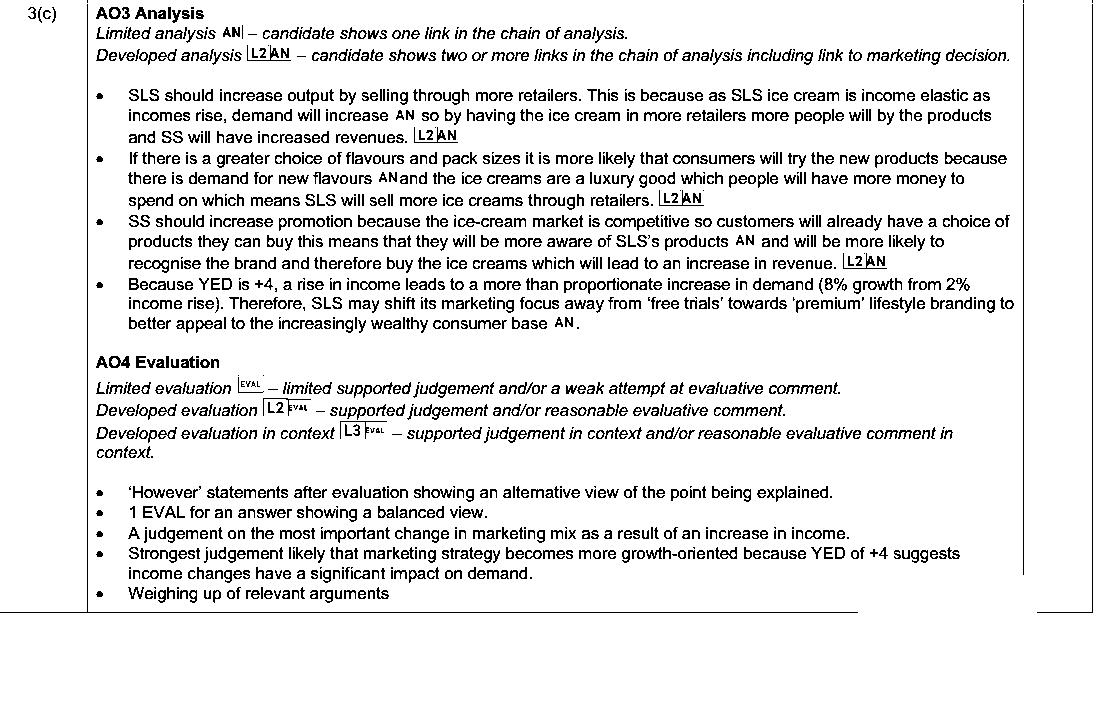
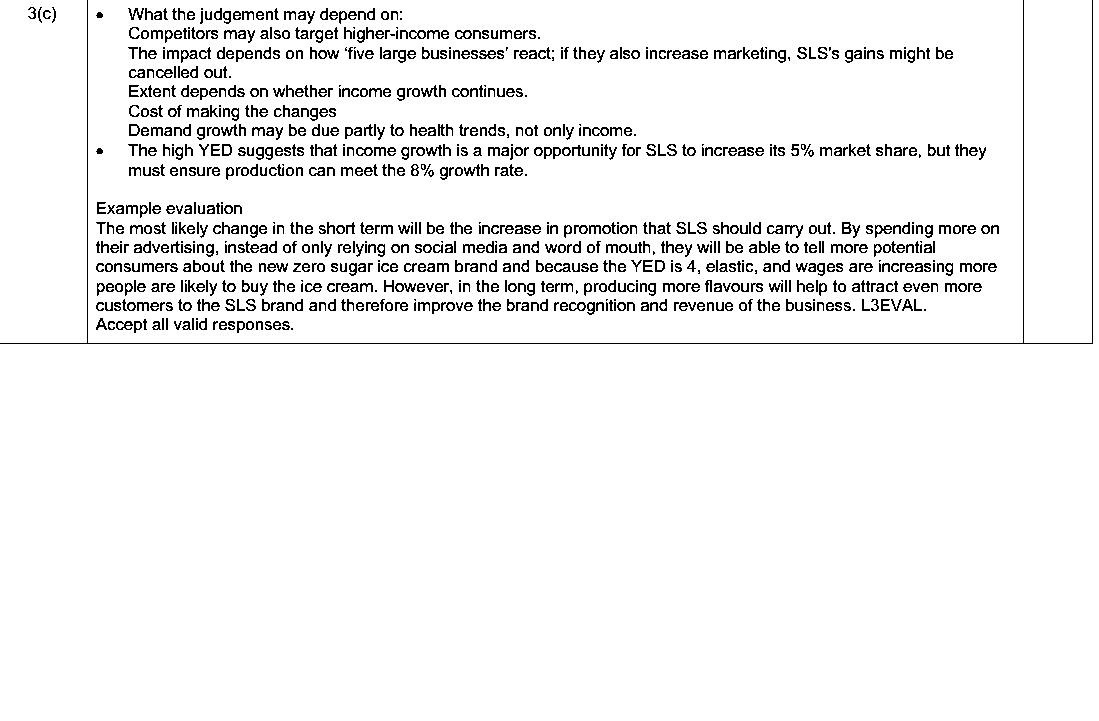
(c) Evaluate the likely impact on the marketing behaviour of SLS of an increase in the average income in country A. [12 marks]
Show mark scheme
Case study: Carrum Cars (CC)
CC is a private limited company, based in country W, that sells cars. Gross domestic product (GDP) in country W has increased significantly in the last five years.
CC was set up in 2022 and for two years it traded online and from a small showroom in the centre of city A.
CC does not manufacture cars. The business buys cars directly from manufacturers and then sells these from its showroom and on its website.
Showroom relocation
In March 2024, CC purchased a large plot of land on a busy road in country W. It built a large showroom so that customers can view the cars and take them for a test drive. This investment was financed by a bank loan. In August 2024, CC relocated to the new showroom.
The new showroom building also has offices for the directors and managers and an area for internet sales. Figure 1.1 shows some data about the showroom relocation.
CC’s new showroom:
opened in August 2024
capacity to store 70 cars in inventory at any one time
employee and customer parking for an additional 30 cars
two other competitor car showrooms within 5 km
closest populated areas: city A – 9 km away, population 500 000 city B – 21 km away, population 200 000.
Figure 1.1 Data about CC’s showroom relocation
Organisational structure
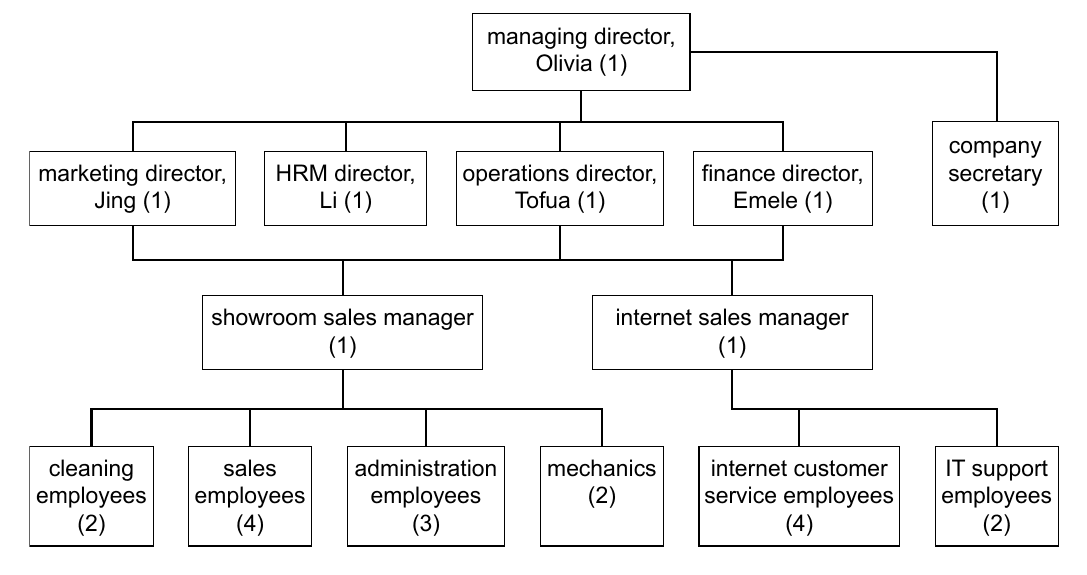
At a recent meeting of the board of directors, the efficiency of CC was discussed. Figure 1.2 shows the current organisational structure for CC in 2026. The number in brackets in each box shows the number of employees in that role.
Figure 1.2 CC’s organisational chart
CC’s finance director, Emele, thinks that the business has too many levels of hierarchy. She has proposed that CC delayers the company by making the showroom sales manager and the internet sales manager redundant. She has proposed that CC should invest in an Enterprise Resource Planning (ERP) programme which would take over most of the managerial functions currently carried out by the two managers.
The showroom sales employees are paid using commission based on achieving sales targets. The cleaners are paid country W’s minimum wage, and the other employees are paid a salary. The mechanics are paid a relatively high salary due to a skills shortage in country W. ERP investment appraisal
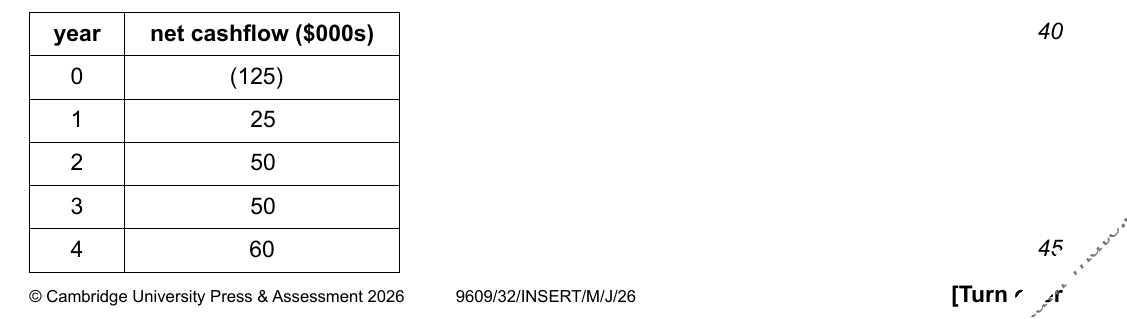
Emele has carried out an investment appraisal for the proposed ERP programme (see Table 1.1). There is no residual value for this investment at the end of its four-year life.
Table 1.1 Net cashflow for the proposed ERP software
Inventory control
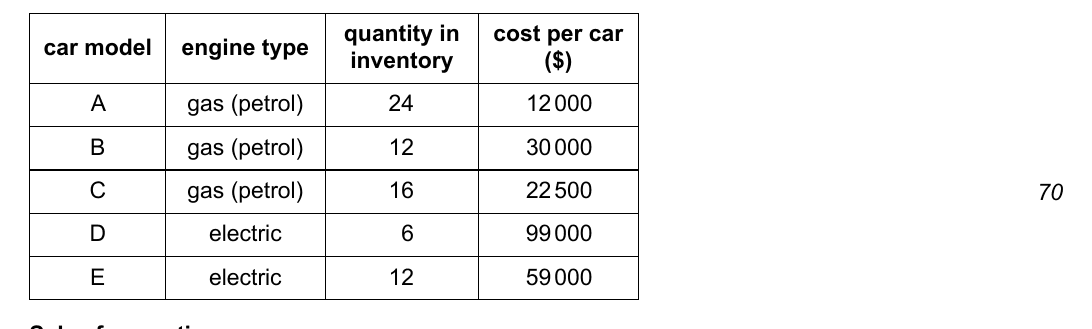
The operations director, Tofua, is more concerned about the inventory held by CC. ‘When we were located at the old showroom, we held very little inventory’ said Tofua, ‘and it worked well for us. However, since opening the new showroom, we have been holding more and more inventory, and it is causing significant opportunity costs.’ Table 1.2 shows inventory and cost data for CC.
Table 1.2 Inventory and cost data for CC
The managing director, Olivia, thinks that reducing the inventory level in the showroom would be an inappropriate decision. She knows that many customers expect to be able to see and test drive a car before they agree to purchase it. Without inventory of the different car models CC sells, she worries that demand will decrease, especially with the current high inflation rate in country W.
Tofua has prepared a summary report of CC’s current inventory (see Table 1.3).
Table 1.3 CC’s current inventory
Sales forecasting
At a recent board meeting, Jing, the marketing director, presented the quarterly sales forecast. An extract from the quarter 3 (July to September) 2026 forecast is shown in Figure 1.3.
July and August – low sales due to customers prioritising vacations.
September – manufacturers launch new car models – high sales expected.
market trends – 35% increase in demand for electric vehicles.
Figure 1.3 Extract from Q3, 2026 CC sales forecast
Olivia, the managing director, is concerned that Jing’s forecast does not include more qualitative sales forecasting.
Question 4May/Jun 20269609/3216 marks
(a) Using the data from Table 1.2, calculate the change in CC’s rate of inventory turnover between 2024 and 2025. cost. [4 marks]
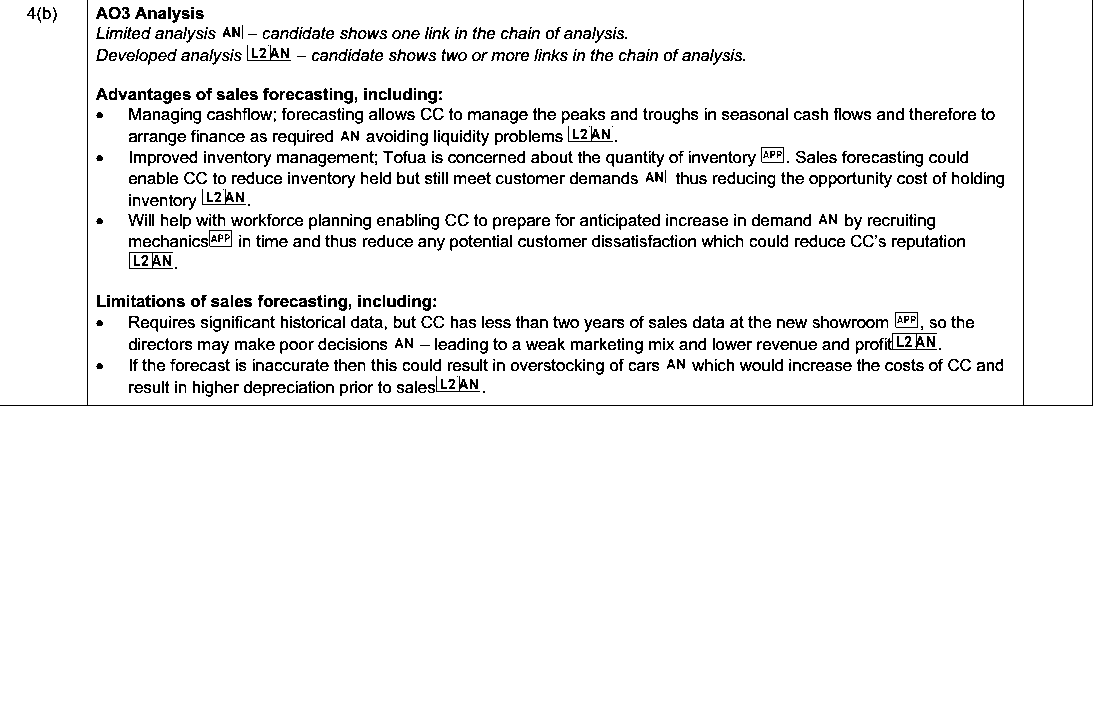
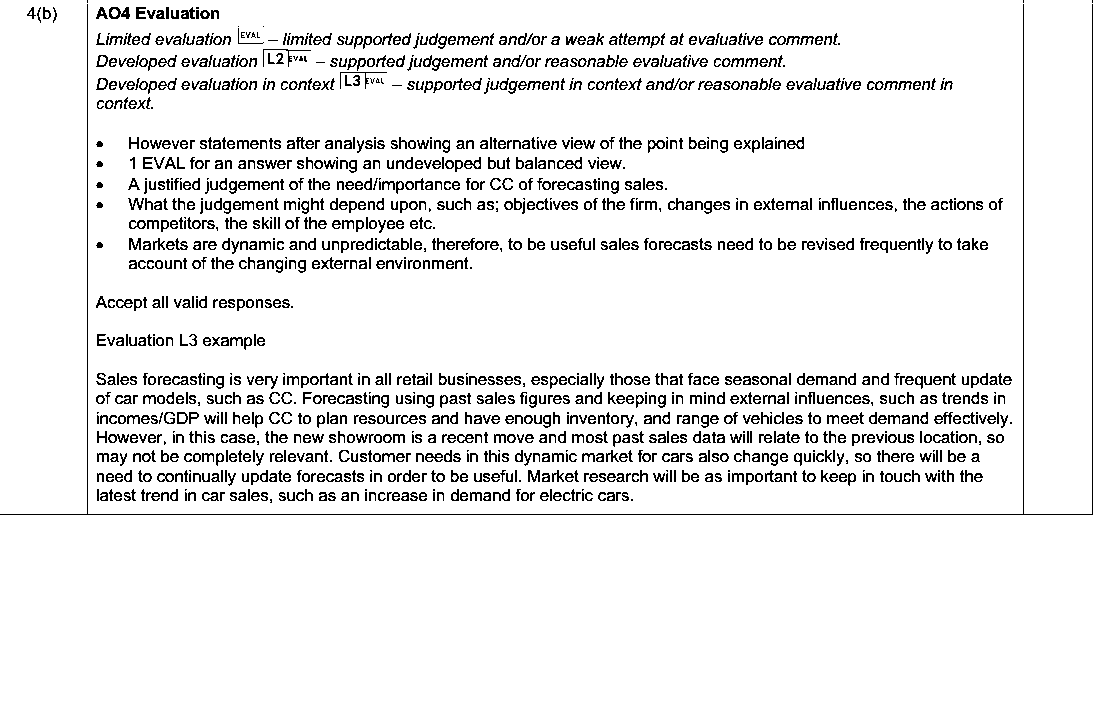
(b) Evaluate the importance for CC of forecasting sales. [12 marks]
Show mark scheme
Case study: Reeta Roy (RR)
RR is a manufacturer and retailer of luxury beauty products. Reeta Roy started RR in 2016 after managing several small enterprises with limited success.
Using her creativity, Reeta produced the first batch of soap in her kitchen. Reeta used fresh ingredients from her home region of country X. Customer feedback was positive and Reeta decided to form a private limited company. RR rented a local factory to start production. The location of the factory was important as Reeta’s business plan was to work with local farmers who could supply fresh ingredients. RR decided not to use machines and instead recruited skilled workers to hand-make its products.
Reeta believes the culture of RR is essential in creating a luxury product. Reeta expects employees to share her pride in RR’s products whether they work in manufacturing or have face-to-face contact with the final consumer.
RR’s first retail store opened in 2017 selling only RR products. By 2026, RR had opened 22 retail stores in country X, with more planned.
Reeta’s leadership
Though employees admire Reeta’s determination, energy and charisma, RR has a high labour turnover of graduate level managers due to limited promotion opportunities and training. Reeta believes that leaders are born with the traits and abilities to lead.
Supply issues
The success of RR’s brand is built on using local ingredients. Sourcing quality ingredients to meet demand is a constant problem. RR occasionally has to accept a variation in the standard of ingredients. Some of RR’s products made using these ingredients have to be rejected after quality control. The operations manager has suggested that RR should introduce lean production.
Country X’s economic performance
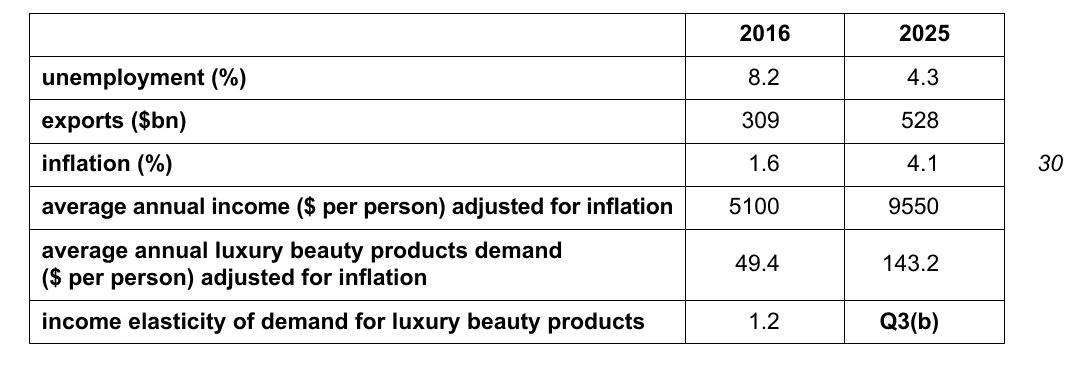
Since 2016, there has been rapid economic growth in country X, see Table 1.1.
Table 1.1 Country X economic data
International expansion
RR plans to expand internationally. Reeta wants RR to expand by opening retail units in other countries. However, the marketing team believes that RR should start selling its products using information technology (IT), for example, by using RR’s website and social media. Reeta believes that selling online will have a negative impact on RR’s luxury brand. Reeta thinks that the consumer’s positive interaction with the retail staff is important.
Table 1.2 shows some information about the sales of luxury beauty products in country X.
Table 1.2 Sales of luxury beauty products in country X ($m)
A survey of RR’s consumers found that 60% said visiting an RR store was a key factor in their purchase decisions and that 45% would consider buying RR products online.
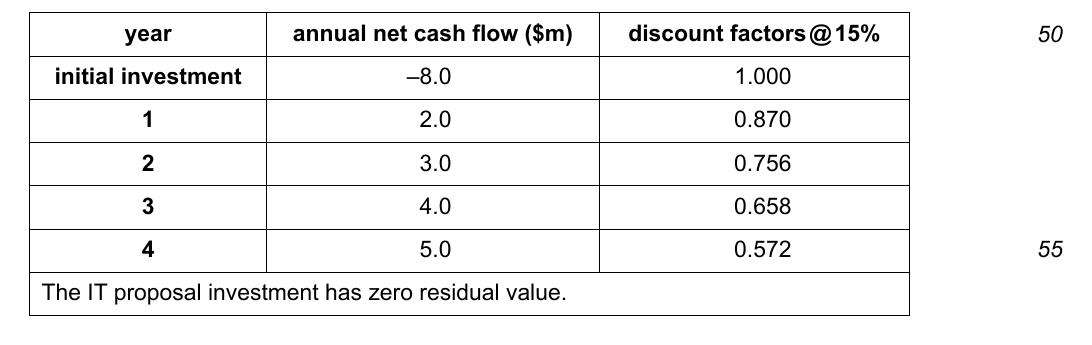
The marketing team has produced an investment appraisal for its IT proposal, see Table 1.3.
Table 1.3 Investment appraisal for the marketing team’s IT proposal
FSA
FSA is a multinational company and the market leader in beauty products. FSA is aiming to add to its portfolio of luxury brands. RR’s growing reputation has come to the attention of FSA’s Chief Executive, Gabriel Laurent. Gabriel met with Reeta to discuss purchasing 20% of RR’s share capital. Gabriel was impressed by Reeta’s vision for RR and her leadership values. Reeta has placed a high financial value on RR’s shares which is far greater than shown by RR’s latest published accounts. FSA’s Chief Financial Officer (CFO) is concerned by RR’s lack of detailed accounting data including financial ratios. However, Gabriel is convinced that buying 20% of RR’s shares at the value proposed by Reeta is a unique investment opportunity for FSA.
Question 3May/Jun 20269609/3316 marks
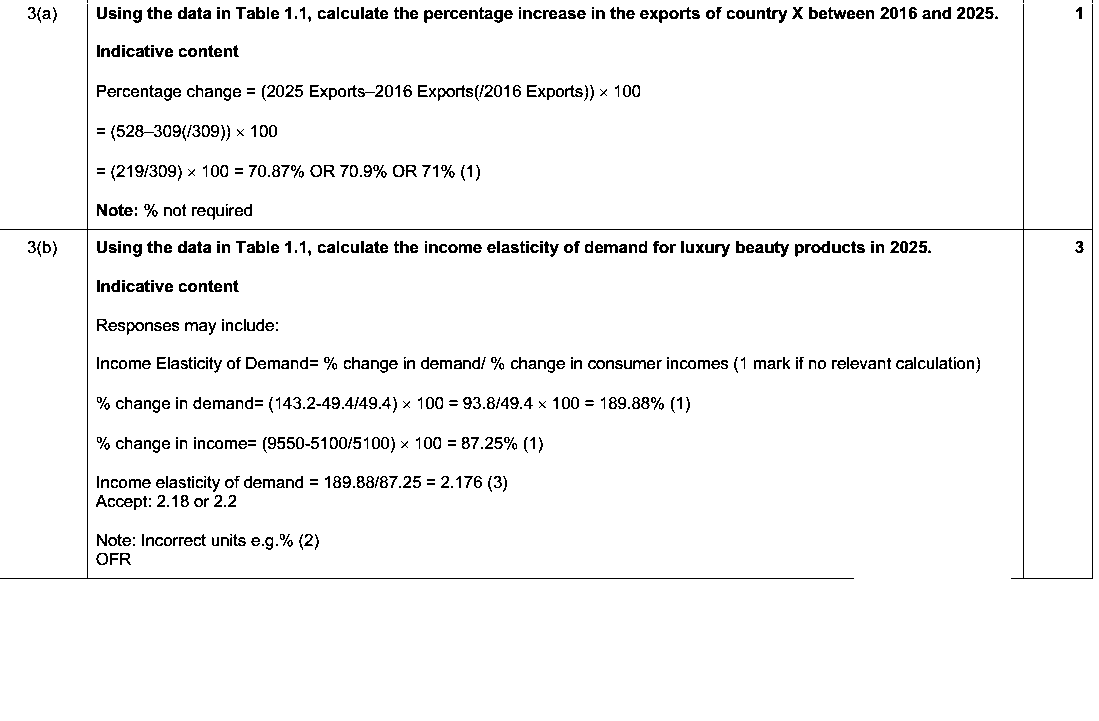
(a) Using the data in Table 1.1, calculate the percentage increase in the exports of country X between 2016 and 2025. [1 marks]
(b) Using the data in Table 1.1, calculate the income elasticity of demand for luxury beauty products in 2025. [3 marks]
(c) Evaluate the likely impact on RR of the rapid economic growth in country X between 2016 and 2025. [12 marks]
Show mark scheme
Case study: Pedro’s Perfect Pies (PPP)
Pedro left school without any formal qualifications. Pedro was given the opportunity to work in a pie factory. This was owned by an entrepreneur who wanted to help unqualified young people.
Pedro spent six years working at the factory. He was quickly promoted because he was conscientious and showed initiative. When the business owner retired, she offered Pedro the chance to buy the business. Pedro raised capital from his savings, friends and family and bought the business. PPP became a private limited company, with Pedro as Managing Director. PPP is based in country A.
PPP manufactures a wide range of pies in its factory. The pies are sold to retailers in country A and other countries in the region.
Growth
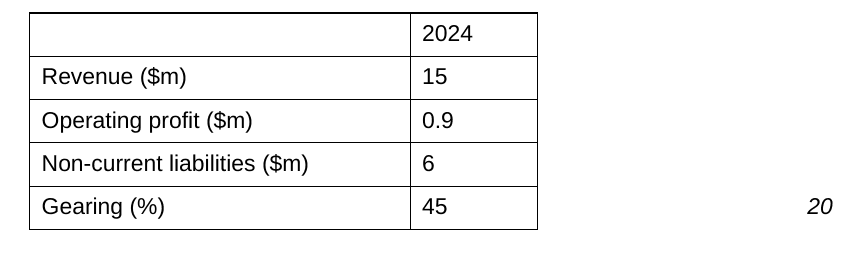
PPP has grown steadily over the last few years. Its revenue and profits have increased by an average of 8% per year. Production capacity has been increased to keep up with demand. Growth has been financed by retained earnings and bank loans. Recent accounting data is shown in Table 1.1.
Table 1.1: Accounting data
External influences
Real incomes in country A and other countries in the region have been falling due to high inflation and low economic growth. Trade between country A and other countries in the region has become more difficult, due to country A leaving an international trade agreement. Consumers are changing their eating habits, and many people are eating less meat.
Marketing
When Pedro bought the business, he identified an opportunity to develop a premium product. Pedro asked the marketing team to carry out market research. The results of this established that there was a market for high quality, higher priced pies. Pedro discussed this new product development with all of his marketing team because he valued their opinions.
Once the premium pies were launched, PPP branded its products as either classic or premium pies. Most pies PPP produces still contain meat. However, a newly developed premium no‑meat vegan pie has started to sell very well. PPP is also planning to launch a new classic pie with a cheese filling especially for the export market.
Elasticity
Due to higher production costs PPP has increased its prices. Pedro has analysed some elasticity data for one type of classic pie and one type of premium pie, see Table 1.2.
Table 1.2: Elasticity data
Human resources
Pedro has always been a self‑confident innovator, both in terms of new product ideas and the way that PPP is organised and led. He is known for his social skills and is respected and trusted by his employees.
Pedro is also keen to help young unemployed people, in the same way as he was helped. PPP offers training apprenticeships in all areas of the factory. Trainees attend local colleges one day each week and are supervised by the department managers.
Pedro thinks employees are PPP’s greatest asset. As well as training apprentices, he offers competitive wages and all employees have opportunities for career development and promotion within PPP. Pedro is also socially aware as he rewards employees for good ideas from weekly kaizen group discussions. Many employees have been with the company for more than five years.
Process innovation
PPP’s current production process is labour intensive and pies are produced using batch production. All employees accept responsibility for product quality and are trained in quality assurance methods.
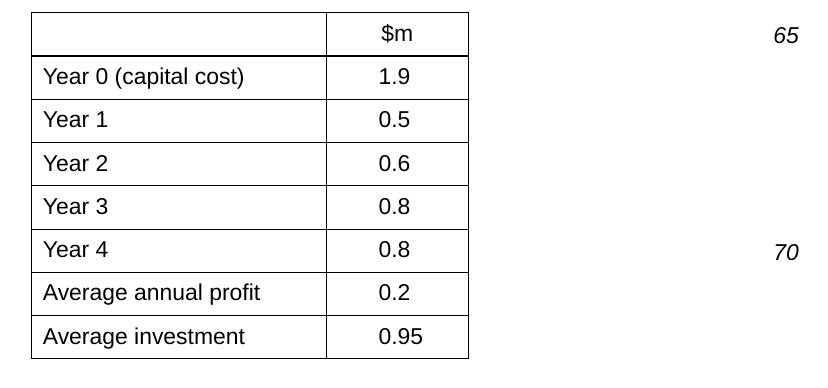
Pedro is considering investing in a new computer‑controlled pie‑making machine, see Table 1.3. This would increase production capacity in the factory. Factory employees would still need to complete the production process by adding the PPP pastry logo to the pies.
Table 1.3: Forecast net cash flow data for the proposed new machine
Pedro is undecided about increasing the use of machinery, especially as PPP will have to borrow the finance to purchase it.
Question 4Oct/Nov 20259609/3116 marks
(a) Using the data in Table 1.2, calculate the monthly revenue from the sales of the classic pie after the price increase. Mark Correct new sales revenue 3500 × $3.60 = $12 600 $ sign not required New quantity of sales 5000 – 30%. [4 marks]
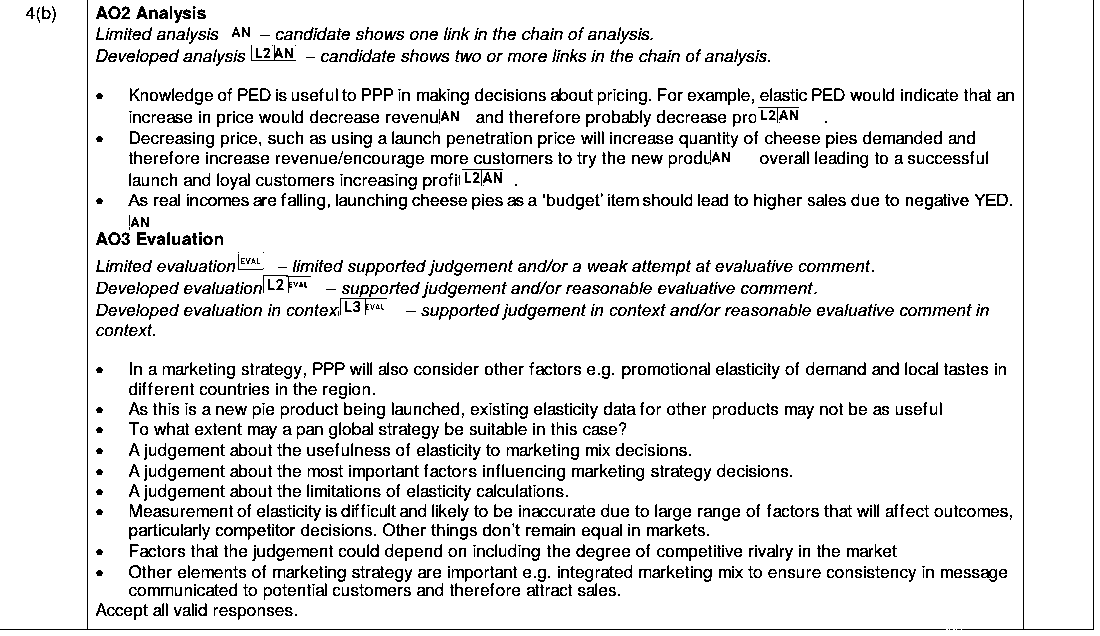
(b) Evaluate the usefulness to PPP of elasticity measures when deciding on the marketing mix for the new cheese pies in export markets. [12 marks]
Show mark scheme
Case study: Komate Tropical Juice (KTJ)
KTJ is a private limited company based in country B in Africa. It was set up in 2014 by Ada Hadebe who is the majority shareholder and Managing Director. KTJ specialises in producing tropical fruit juices. KTJ’s mission statement is ‘to bring the tropical taste of Africa to the world through ethical relationships with farmers by focusing on sustainability throughout the supply chain’.
Sourcing fruit
KTJ’s range of tropical fruit juices includes baobab, papaya and pineapple. Juices are produced from seasonal fruits without added sugar or colourings. Most fruits are sourced from local farm cooperatives in country B. The farms are chosen for their sustainable farming methods which KTJ has to regularly audit. Some fruits, not grown in country B, are imported from other countries in Africa.
Employees
KTJ has a flat organisational structure. Ada encourages a ‘soft’ approach to human resource management (HRM) and believes in the benefits of delegation. Ada is proud that KTJ has won awards in country B for its substantial investment in employee training and development.
Plastic packaging
Recently, one of KTJ’s operations managers commissioned research into KTJ’s use of plastic bottles for its fruit juices. After six months of research the final report recommended that KTJ should in future only use plastic bottles made entirely from recycled materials. Ada is considering whether to implement this change.
Expansion
KTJ has an excellent reputation for the quality of its tropical fruit juices which are marketed as premium products. Export demand has increased significantly during the past two years, especially from other African countries. KTJ’s factory in country B is nearing full capacity. Ada thinks that KTJ should expand by processing tropical fruit in a location outside of country B. Ada authorised Gudaf, a junior market analyst, to prepare a report identifying the two best locations for the additional new factory. Gudaf visited multiple locations and prepared an investment appraisal. Gudaf will present the report to the Board of Directors next week recommending a location in either country C or country D.
Extracts from Gudaf’s report are in Table 1.1, Table 1.2 and Table 1.3.
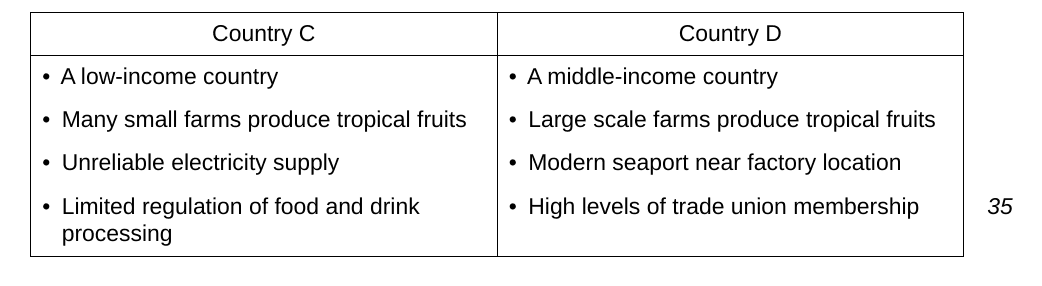
Table 1.1: Information about country C and country D
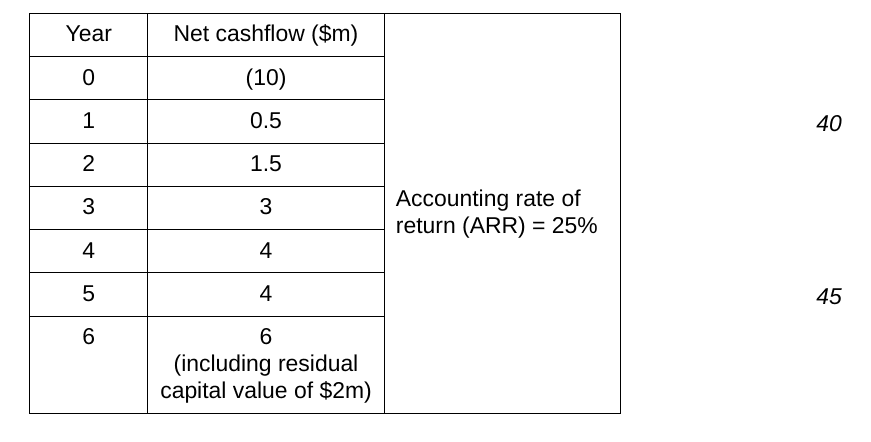
Table 1.2: Investment data for country C location
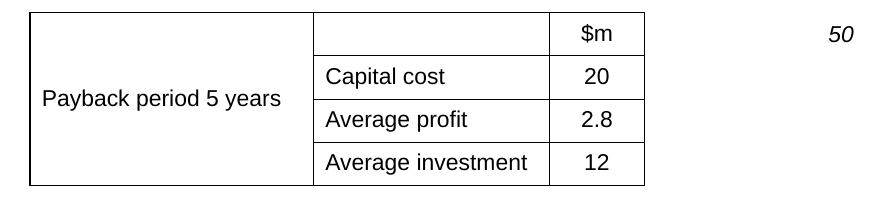
Table 1.3: Investment data for country D location
Seasonal sales
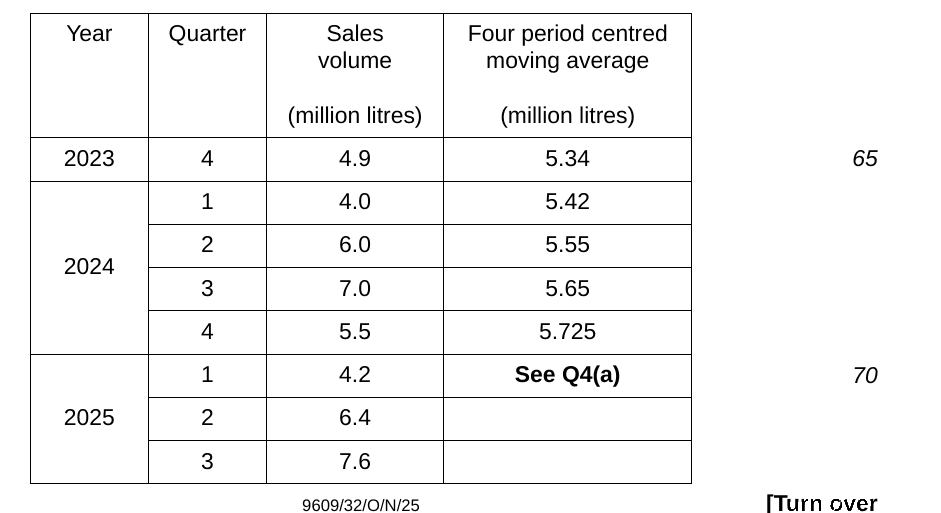
Since 2018, KTJ has exported tropical fruit juices to the US. The US is one of the world’s most competitive markets for food and drink products. Sales are increasing and have met targets. Ada believes that KTJ can increase its market share significantly. Ada instructed the US marketing manager to carry out a market analysis and then develop a new marketing plan. The marketing manager is using time series analysis to help make business decisions. Table 1.4 is an extract of KTJ sales data in the US.
Table 1.4: KTJ tropical juice sales in the US by volume
Fluctuations in the exchange rate
Ada monitors the external environment carefully to identify changes that will impact KTJ. There have been fluctuations in the exchange rate of country B’s currency in recent years. At the last 75 Board Meeting Ada commented ‘financial markets have been unsettled by the recent change of government in country B. This has led to an average 20% depreciation in the value of country B’s currency. This presents both an opportunity for, and a threat to, KTJ.’
Question 4Oct/Nov 20259609/3216 marks
(a) Using the data in Table 1.4, calculate the four period centred moving average for Quarter 1 2025. [4 marks]
(b) Evaluate the usefulness of time series analysis to KTJ in making business decisions. [12 marks]
Show mark scheme
Case study: Lithium Battery Metals (LBM)
Lithium is an essential raw material used in batteries for electric vehicles, smart phones and other products. LBM has developed techniques to detect lithium using mapping technology. LBM sells its survey results to other mining companies. LBM’s annual revenue is less than $1 million and it is losing $2–3 million per year. LBM is planning to start its own lithium mining operations in country G, where it is based.
LBM has researched and developed two effective ways of mining lithium. The first is hot water mining and the second is hard rock mining. LBM became a public limited company one year ago. LBM has substantial finance obtained from grants, shareholders and crowdfunding available for investment. LBM’s revenue is forecast to rise rapidly once mining begins.
Sales forecasting
Annual global demand for lithium is rising considerably and forecasts show world supply will not meet demand after 2030. As LBM establishes its own mining operations it will need to forecast sales. There are likely to be variations in demand for electric vehicles and smart phones over time. It is difficult to vary the output from lithium mines at very short notice. Holding inventory of this raw material involves high costs. Alternatives to lithium are being developed.
Concerns of government
LBM is the only business in country G planning to mine lithium. The government is very concerned that:
demand from industry for lithium in country G will not be met in the long‑term
LBM is currently unprofitable
LBM may be a target for a hostile takeover from a multinational business.
The government is therefore considering nationalising LBM.
Hot water lithium mining
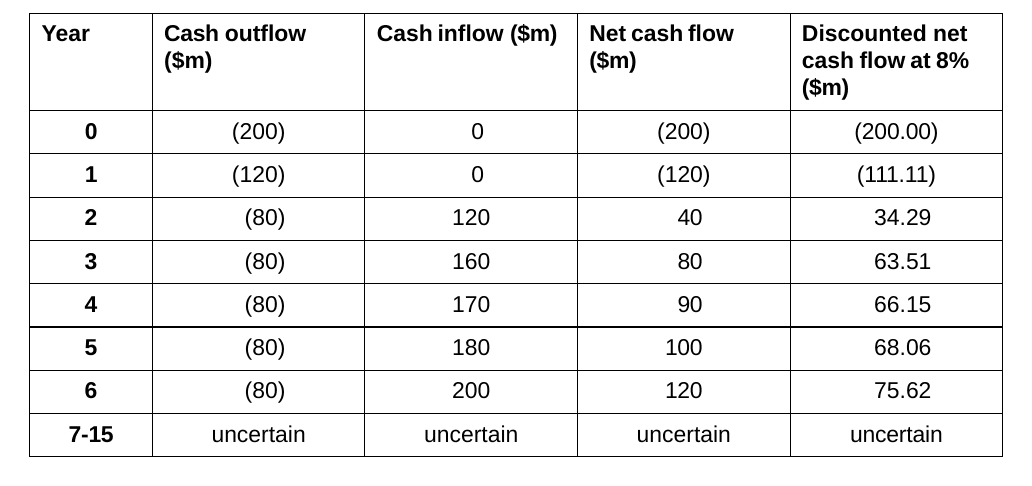
Despite local opposition, LBM plans to open its first mine in four months’ time. Hot water from three kilometres underground will be pumped up to a factory where lithium and possibly other rare raw materials will be extracted from the water. After the extraction process the hot water can then be used for heating local housing. The Operations Director, Astor, estimates the project has a 15‑year life span. However, future cash flows beyond six years become increasingly uncertain.
Table 1.1 shows the data used by LBM in the decision to go ahead with the hot water mine. The data excludes costs and revenues from extracting other raw materials that may be found in the water. LBM has enough finance for the hot water mine if there are no adverse variances to the budget.
Table 1.1: Investment appraisal for hot water lithium mining
Human resource management (HRM) and the hot water mine
LBM uses a ‘soft’ HRM approach for its current 35 graduate employees. They are given delegated powers and decide their own work patterns individually or in self‑selected teams. Many of these graduates are involved in using the mapping technology to find new mines and developing mining techniques.
LBM has started recruiting 150 people to be employed at the hot water mine site. Ten new employees will be technology specialists who will closely supervise the work. The other new employees will be trained to operate machinery. The directors plan to use a ‘hard’ HRM approach for these machine operators.
Hard rock lithium mining
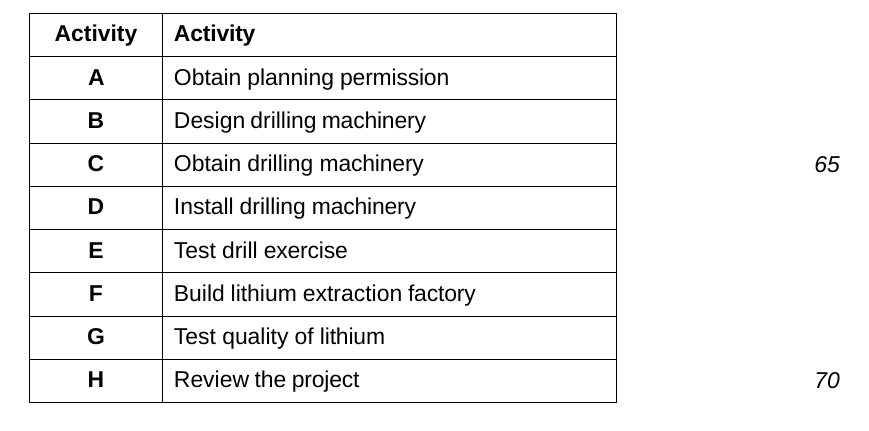
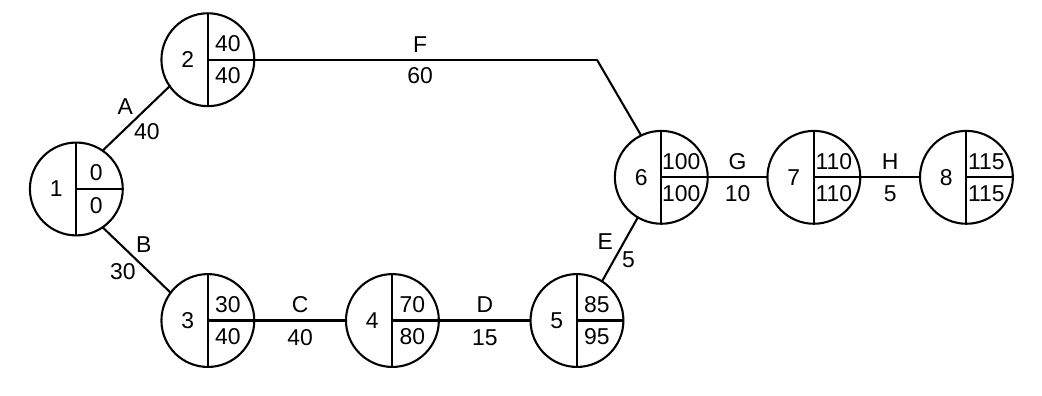
LBM is also planning to open a hard rock lithium mine in two years’ time. Lithium is found inside hard rock layers underground. LBM plans to drill into these, bringing rock to the surface to be treated to extract lithium. Astor has identified a suitable area 500 metres underground. Table 1.2 and Figure 1.1 show the results of some of his operations planning. The data was obtained from mining industry sources, suppliers of drilling equipment and the LBM Research and Development (R & D) team.
Table 1.2: Hard rock lithium mining project activities used in Critical Path Analysis (CPA)
Figure 1.1: Network for hard rock lithium mining project (durations in weeks)
Question 2Oct/Nov 20259609/338 marks
Analyse one benefit and one limitation of sales forecasting to LBM as it begins its mining operations. [8 marks]
Show mark scheme
Case study: Wisdom Shoes (WS)
WS is a public limited company. WS manufactures leather shoes for adults. It sells to major shoe retailers and to small independent shoe shops. WS products are targeted at three constantly changing markets: fashion, leisure and work. Its sales employees are reporting that small independent shoe shops have experienced an increasing demand for non-leather and recyclable shoes. There is a growing consumer awareness that resources used in production need to be sustainable. Jon, the Marketing Director, is very keen for WS to carry out an environmental audit.
Enterprise resource planning (ERP) WS uses different IT systems for managing production, marketing and human resources. Keri, the Operations Director, thinks that the processes needed to produce and market shoes could be more integrated. Greater integration could help to improve the efficiency of WS. Keri has begun to research ERP as a means of achieving this integration. She knows that ERP is very expensive and takes time to implement but she is convinced that it could offer WS substantial efficiency benefits.
Employee performance
WS uses batch production to produce different styles of shoes. The production employees at WS are:
paid wages which are 10% more than the industry average
increasingly complaining to their managers about production targets
expected to train on-the-job
expected to follow strict instructions
given only limited opportunities for career progression.
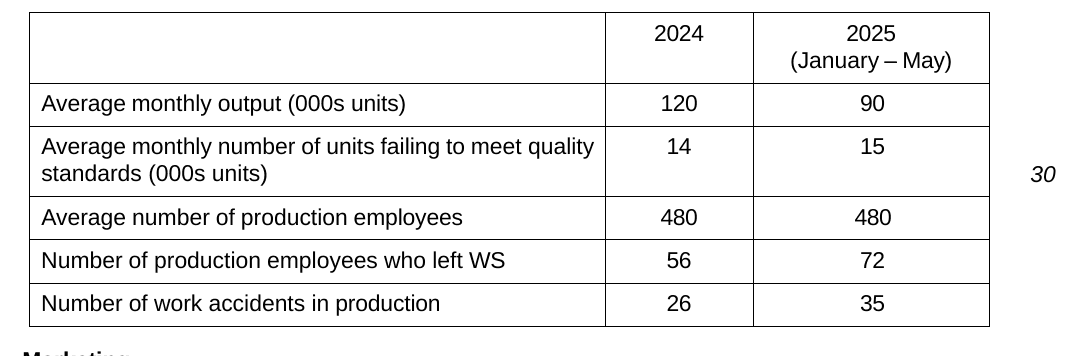
Milo, the Human Resources Director, and Keri are concerned that the performance of production employees is declining. Table 1.1 gives data about production and production employees.
Table 1.1: Data about production and production employees
Marketing
WS sells its shoes into three markets: fashion, leisure and work. Each market has its own characteristics. WS shoes are medium to high price in each market. Research shows that consumers consider WS shoes are good quality for the prices charged.
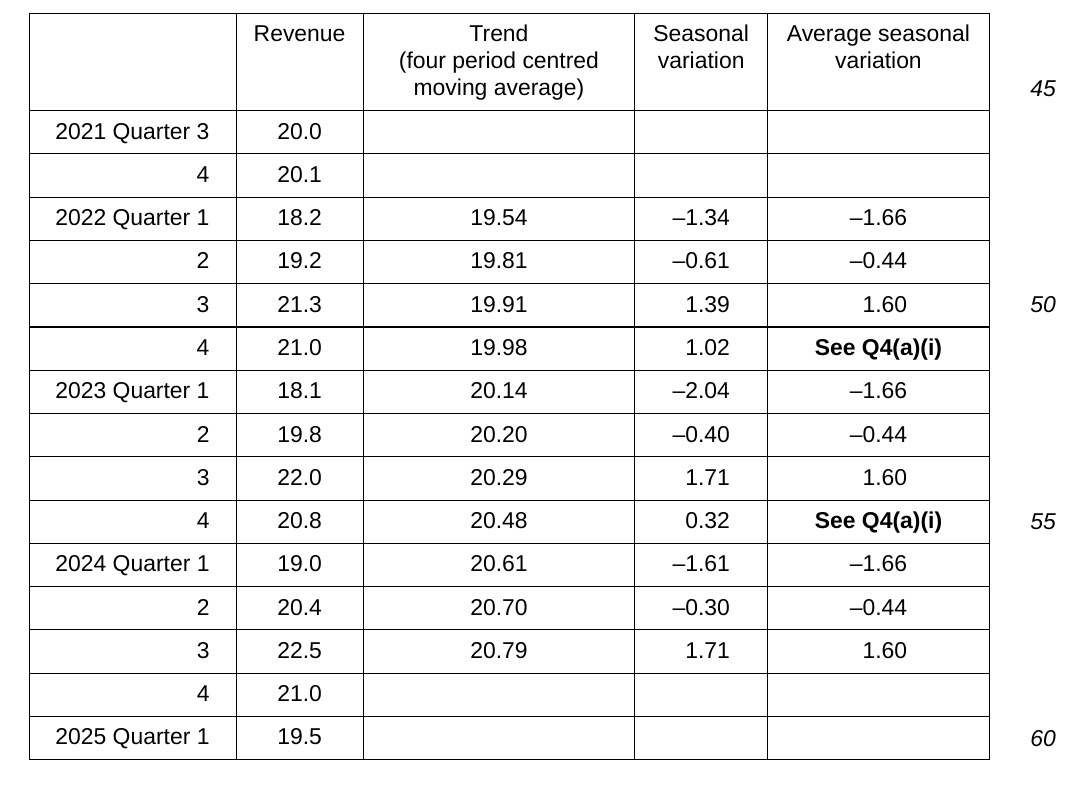
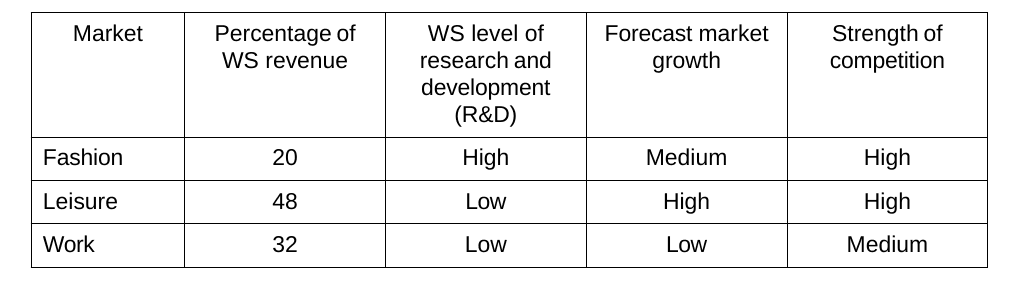
Jon is preparing a marketing plan with the objective of increasing annual sales by 5% without entering any new markets. Table 1.2 shows time series analysis sales data Jon is using. Jon considers that time series analysis will help him make decisions to achieve WS’s marketing objective. Table 1.3 gives additional information about the markets WS sells to.
Table 1.2: WS time series analysis sales data ($m)
Table 1.3: Information about the markets WS sells to
Investor return
In recent years, the directors of WS have made long-term investment a priority rather than short-term increases in dividends.
The main shareholders in WS take an active interest in the business. At the next company Annual General Meeting (AGM) these shareholders intend to ask the directors to explain their method to increase investor returns. These shareholders will be looking for an effective method to achieve an increase in their return. Table 1.4 shows changes in key investment indicators and ratios.
Table 1.4: Change between May 2023 and May 2025
Question 4May/Jun 20259609/3116 marks
(a)(i) Using the data in Table 1.2, calculate the average seasonal variation for Quarter 4. Average seasonal variation = Total seasonal variation for Quarter 4 2022–3 / 2. OR 1.02 + 0.32. [2 marks]
(a)(ii) Jon has calculated the trend for 2025 Quarter 4 as $21.41 million. Using your answer to (a)(i), calculate forecast sales for 2025 Quarter 4. Forecast revenue = forecast trend plus average seasonal variation for that quarter OR 21.41 + 0.67 (1) 21.41 + 0.67 = ($)22.08 (million) (2). [2 marks]
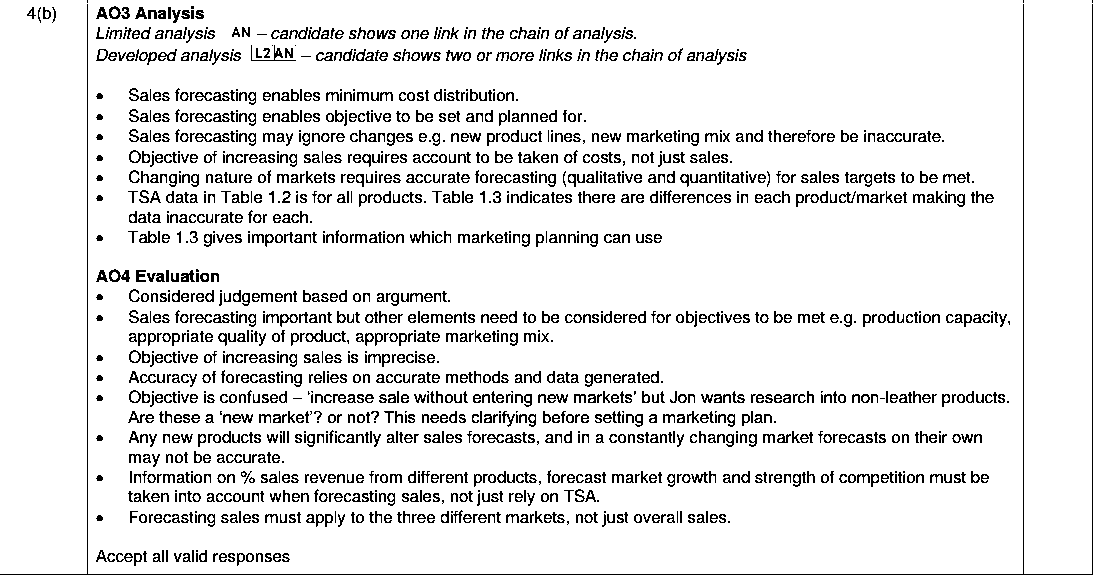
(b) Evaluate whether time series analysis is sufficient to allow WS to make decisions to achieve its marketing objective. [12 marks]
Show mark scheme
Case study: Pura AI Robots (PAIR)
PAIR was set up in 2012 by Kaarina Laine, a graduate in Applied Artificial Intelligence. PAIR is a private limited company in country F. Kaarina, the Managing Director, owns 70% of the shares. Four other directors own the remaining shares.
PAIR’s mission statement is ‘to transform business use of robots’. PAIR designs and manufactures robots which use artificial intelligence (AI) to support business operations. PAIR’s most successful robot, the KB1, is an autonomous cleaning robot. In 2024 the KB1 had the leading market share in country F. It is also a successful export for PAIR. The global market for autonomous cleaning robots is competitive with many brands available.
Growth
The first version of the KB1 was launched in 2013. PAIR’s sales strategy focused on leasing to businesses to provide a cost-effective solution to cleaning the workplace. Initially sales growth was slow, led by the sales team contacting prospective customers to arrange product demonstrations and trials.
However, global economic growth after the pandemic led to labour shortages which affected the recruitment of cleaning employees. Consequently, many schools, offices and hotels approached PAIR to lease the latest version of the KB1. Revenue grew rapidly from 2021 but PAIR was unable to fully meet demand due to production constraints.
Innovative technologies
PAIR invests 7% of revenue in Research & Development (R&D) compared to the industry average of 5%. In 2023, the eighth version of the KB1 was launched providing a more innovative, powerful and quieter cleaner. This version has a longer battery life and can clean different floor types. It uses video technology to learn as it cleans.
In 2024, PAIR began development of a new AI delivery robot, Delbot, which will target the hotel market. It will deliver food, towels and other items to hotel rooms. Kaarina confirmed, in a press release, that the Delbot will be available to customers from early 2026. She commented that the whole process from concept to product launch will only take 18 months.
Organisational structure
PAIR has a flat organisational structure and is divided into functional departments. The R&D department uses a matrix structure creating one-off teams for specific projects. In 2024 PAIR employed a total of 120 employees.
Quality defects At the end of 2023 PAIR’s Operations Director reported increasing quality problems:
the annual percentage of defective KB1s, reported by quality control inspectors, had doubled to 2%
increased customer reports of KB1s not working properly
increased complaints of poor customer service.
In June 2024 PAIR began the process of replacing quality control with quality assurance. This included:
improved training of employees
all production employees made responsible for quality
targets for technicians to fix any faults reported by customers within 24 hours. a
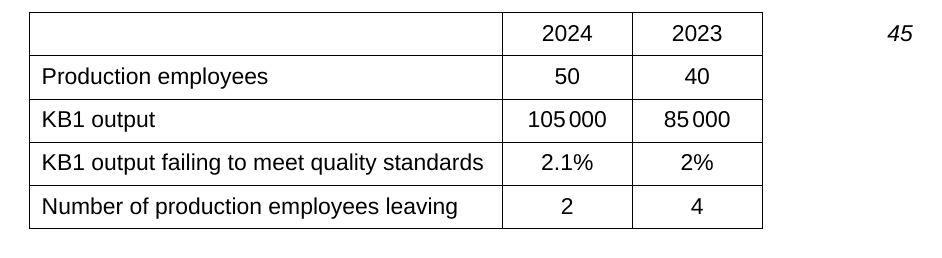
Table 1.1 provides production and employee data for the KB1 factory. In 2024 PAIR had a labour productivity target of 2200 KB1s per employee.
Table 1.1 End of year production and employee data for the KB1 factory
Kaarina is concerned whether the decision to introduce quality assurance has been beneficial for PAIR.
Increase dividends?
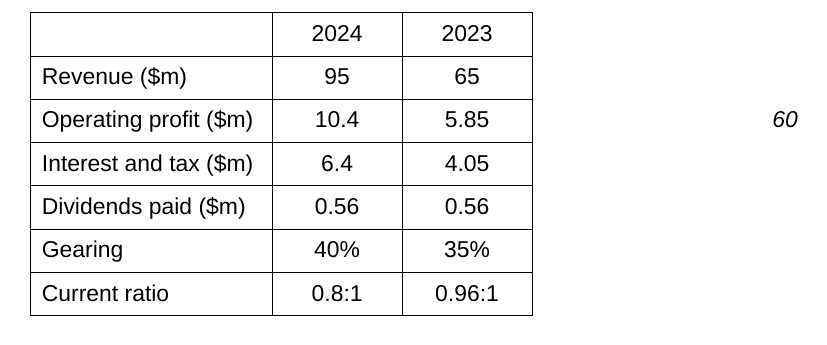
Kaarina plans to expand the product portfolio and enter new international markets. PAIR’s growth has been financed from retained profit and long-term borrowing. Kaarina is now considering whether to change PAIR to a public limited company. Table 1.2 shows selected financial data and ratios for PAIR.
Table 1.2 Selected financial data and ratios for PAIR
The other four shareholders are dissatisfied with PAIR’s dividend payments and are pressuring Kaarina to increase dividends for 2025.
Contingency planning
In February 2025 a battery in one of the latest KB1 robots overheated causing a fire at the school where it was operating. The Operations Director investigated and found that there was a fault in the battery supplied to PAIR. Following the investigation PAIR issued a press release in April identifying the battery supplier as being responsible for the fire. The Marketing Director is concerned about PAIR’s lack of contingency planning. She has finally persuaded Kaarina to call an emergency board meeting to consider the benefits of contingency planning.
Question 5May/Jun 20259609/3212 marks
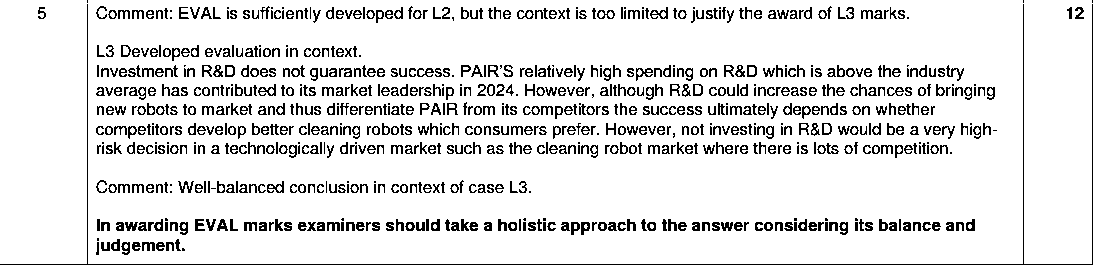
Evaluate the importance of Research and Development (R&D) to PAIR’s future success. [12 marks]
Show mark scheme
15 more questions from 2020–2024
🔒 Unlock every Marketing analysis question from 2020–2024
All 15 come with their mark schemes, answers and case studies, and appear in the practice tool above once you’re signed in. It’s free.
9609/33 · Oct/Nov 2024 · Question 3Calculate the forecast change in sales for… 🔒
9609/31 · May/Jun 2024 · Question 4Calculate the price elasticity of demand (PED)… 🔒
9609/32 · May/Jun 2024 · Question 31.… 🔒
9609/33 · May/Jun 2024 · Question 2Analyse two benefits to SCC of developing… 🔒
9609/33 · May/Jun 2024 · Question 42.… 🔒
+ 10 more, by year in the table above
Questions and mark schemes are from past Cambridge papers and are reproduced for revision. Topical Vault is an independent revision resource, not affiliated with or endorsed by Cambridge Assessment International Education.
A Level Business questions by topic
Each topic opens this practice tool with only that topic’s questions, plus how often it comes up and every question on it in one list.
Pick a paper, sub-topics and years to draw from (leave any blank for "all"), choose
how many questions you want, and we'll open a new worksheet page with a random set for you to review
and download.