Unit 7: The price system and the microeconomy · A Level Economics
Cambridge 9708, Paper 3 & 4. 1,666 questions, 2020 to 2026.
Topic
Year
Paper 3 multiple-choice questions and Paper 4 data-response/essay questions and case
studies, retyped from the original Cambridge material; artwork and data tables are reproduced as images.
Mark schemes show the official answer key and level-marked indicative content.
About Unit 7: The price system and the microeconomy
Unit 7 of the A Level syllabus goes deeper into the microeconomy: utility, indifference curves and budget lines, efficiency and market failure, externalities and cost-benefit analysis, costs and revenue, market structures, the growth of firms and the objectives of firms.
592 past paper questions on this topic since 2020, across 20 exam sessions.
How often it comes up
Year
Paper 3
Paper 4
Total
Chart
2026
31
9
40
2025
61
20
81
2024
62
14
76
2023
54
19
73
2022
74
30
104
2021
72
39
111
2020
74
33
107
Every 2025–2026 question on Unit 7: The price system and the microeconomy
The whole topic on one page, with answers and mark schemes. Printing this page prints just this list.
Paper 3 · Multiple choice (92)
Question 1May/June 20269708/311 mark
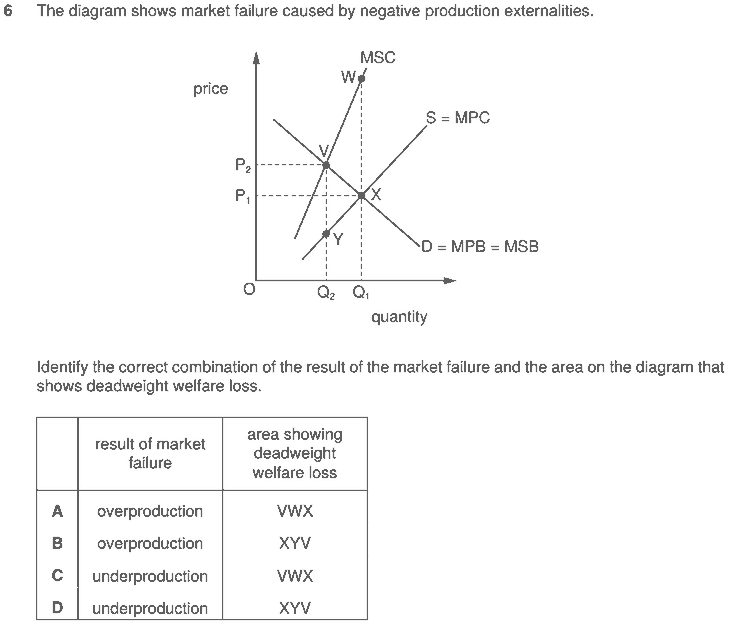
What causes a market to fail and produce more than the optimum output of an economic good?
Athe creation of monopoly power
Bthe presence of a negative externality
Cthe presence of a positive externality
Dthe presence of non-excludability
Show answer
BCorrect answer
Question 2May/June 20269708/311 mark
What is a characteristic of monopolistic competition?
Aabnormal profits in the long run
Ball firms charge the same price
Cbarriers to entry are high
Dproduct differentiation
Show answer
DCorrect answer
Question 3May/June 20269708/311 mark
During a recession, two holiday companies agree to join together and become a single company to improve their chances of survival. How would this be described?
Aa forward vertical merger
Ba forward vertical takeover
Ca horizontal merger
Da horizontal takeover
Show answer
CCorrect answer
Question 4May/June 20269708/311 mark
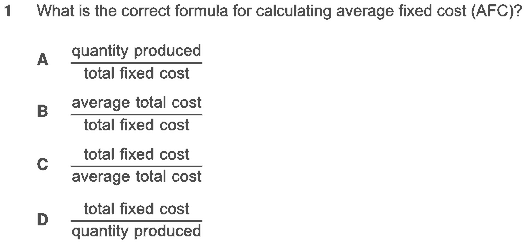
Show answer
ACorrect answer
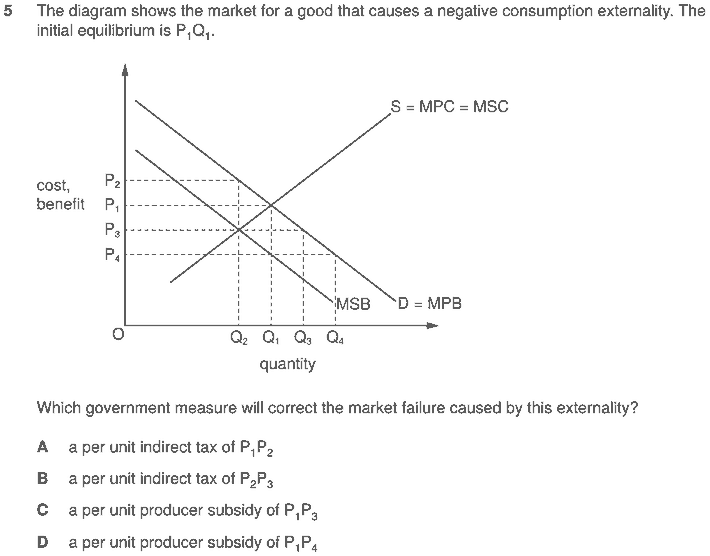
Question 5May/June 20269708/311 mark
Show answer
CCorrect answer
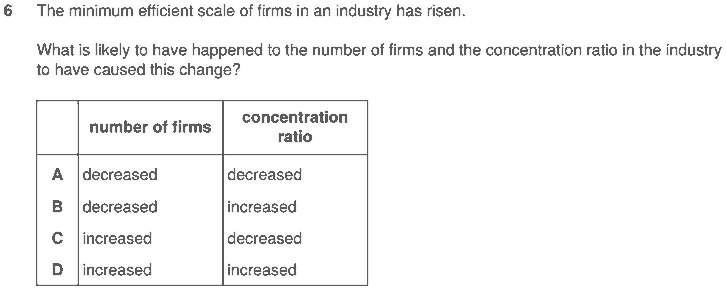
Question 6May/June 20269708/311 mark
Marginal utility theory measures consumer satisfaction and concludes that the value of marginal utility a consumer places on a good will determine the price they are willing to pay for that good. The price of a bottle of water, which is vital for human survival, is less than the price of luxuries, such as designer clothing. Which statement is least likely to explain this?
Adifferent consumers have different marginal utilities for the same good
Bmoney does not measure utility accurately
Cprice is better at measuring the value of exchange than the value of satisfaction
Dprice is determined by both marginal utility and marginal cost
Show answer
ACorrect answer
Question 7May/June 20269708/311 mark
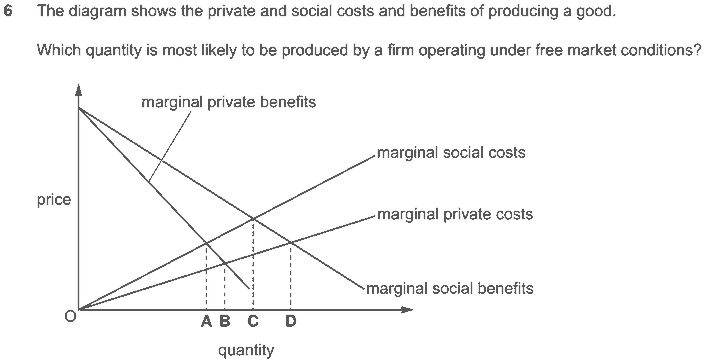
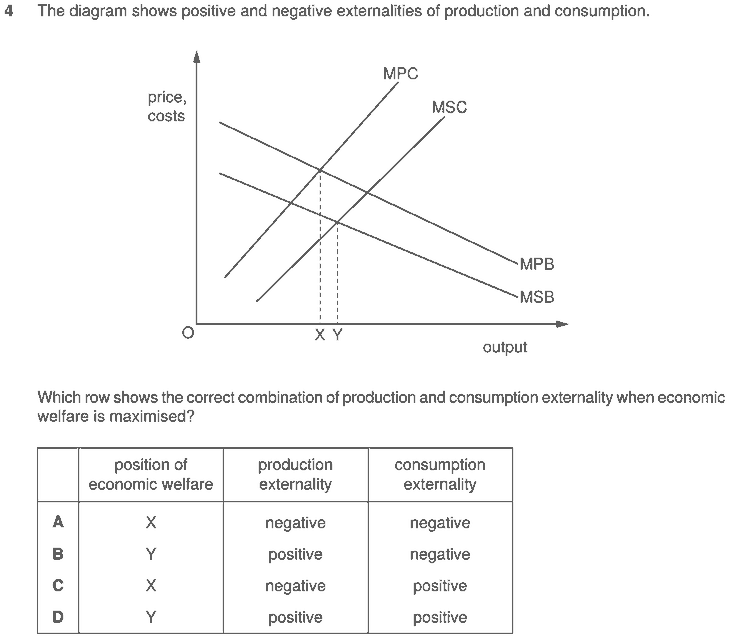
In a market system, a good creates a negative production externality and a positive consumption externality. When will the market equilibrium achieve an allocatively efficient output of the good?
Awhen the marginal external cost = the marginal external benefit
Bwhen the marginal external cost > the marginal external benefit
Cwhen the marginal external cost < the marginal external benefit
Dwhen the marginal private benefit = the marginal social benefit
Show answer
ACorrect answer
Question 12May/June 20269708/311 mark
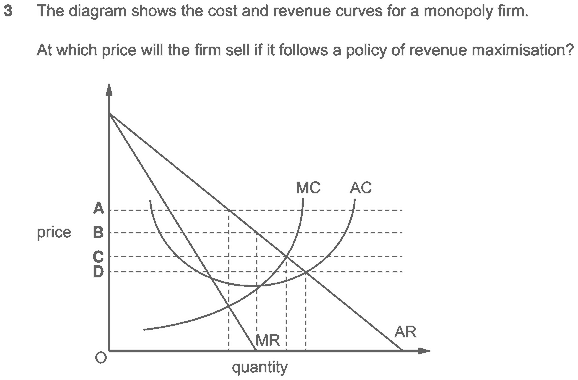
Show answer
BCorrect answer
Question 1May/June 20269708/321 mark
When do consumers maximise utility under the equi-marginal principle?
AWhen each additional unit of a product consumed decreases by equal amounts.
BWhen the average utility per dollar spent is the same for each product.
CWhen the marginal utility per dollar spent is the same for each product.
DWhen the total utility for each product consumed is the same.
Show answer
CCorrect answer
Question 2May/June 20269708/321 mark
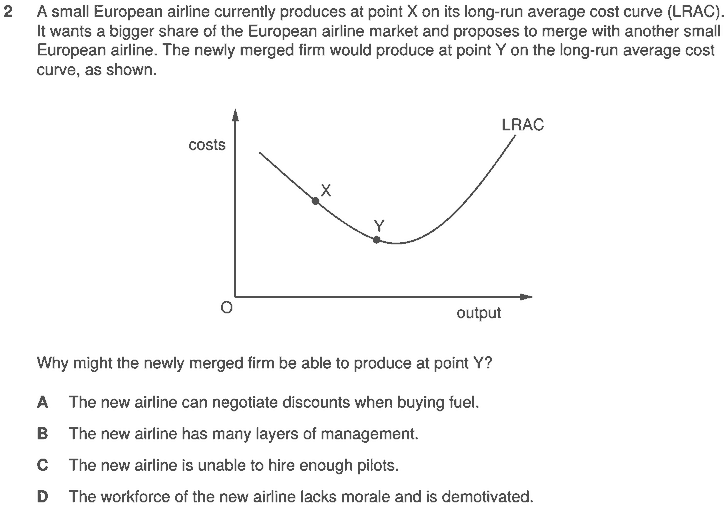
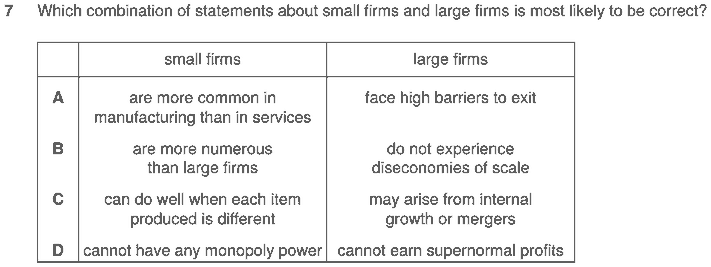
What is a likely reason for a firm to remain small?
Ato diversify the product range offered to consumers
Bto decrease average fixed costs
Cto increase market share
Dto provide better customer service
Show answer
DCorrect answer
Question 3May/June 20269708/321 mark
Show answer
BCorrect answer
Question 4May/June 20269708/321 mark
Show answer
BCorrect answer
Question 5May/June 20269708/321 mark
What must be found in two markets for price discrimination to be profitable?
Adifferent price elasticities of demand
Bdifferent price elasticities of supply
Cdifferent producers
Ddifferent products
Show answer
ACorrect answer
Question 6May/June 20269708/321 mark
Show answer
BCorrect answer
Question 7May/June 20269708/321 mark
Show answer
CCorrect answer
Question 11May/June 20269708/321 mark
Show answer
BCorrect answer
Question 1May/June 20269708/341 mark
Show answer
BCorrect answer
Question 2May/June 20269708/341 mark
Show answer
DCorrect answer
Question 3May/June 20269708/341 mark
In the short run, a firm produces an extra unit of output. Which of the firm’s production costs will change?
Afixed cost only
Bfixed cost and variable cost
Cvariable cost only
Dvariable cost and total cost
Show answer
DCorrect answer
Question 4May/June 20269708/341 mark
Two US chemical production firms merged. What is the likely benefit to the US chemical industry of this merger?
Athere will be an increase in competition
Bthere will be an increase in the price elasticity of supply
Cthere will be greater technical economies of scale
Dthere will be less government regulation needed
Show answer
CCorrect answer
Question 5May/June 20269708/341 mark
Show answer
BCorrect answer
Question 6May/June 20269708/341 mark
Show answer
BCorrect answer
Question 7May/June 20269708/341 mark
A firm benefits from dynamic efficiency in the long run. What is the most likely effect of this on the firm’s long-run average cost (LRAC) curve?
Adownward shift
Bmovement to the left
Cmovement to the right
Dupward shift
Show answer
ACorrect answer
Question 9May/June 20269708/341 mark
A producer of a good causes pollution. When will a specific tax on the production of the good be most effective in reducing output?
Awhen there is price elastic demand and price elastic supply
Bwhen there is price elastic demand and price inelastic supply
Cwhen there is price inelastic demand and price elastic supply
Dwhen there is price inelastic demand and price inelastic supply
Show answer
ACorrect answer
Question 1Feb/March 20269708/321 mark
Show answer
DCorrect answer
Question 2Feb/March 20269708/321 mark
Which statement about an indifference curve is correct?
Ait always has a positive gradient
Bit can intersect with other indifference curves
Cits gradient is determined by the marginal rate of substitution
Dthe higher the indifference curve the lower the utility gained
Show answer
CCorrect answer
Question 3Feb/March 20269708/321 mark
Show answer
BCorrect answer
Question 4Feb/March 20269708/321 mark
An oligopolist with a kinked demand curve decides to raise its price. Why might it do this?
Ait has a large increase in costs
Bit is starting a predatory pricing strategy
Cit is trying to price discriminate
Dit wants to start a price war
Show answer
ACorrect answer
Question 5Feb/March 20269708/321 mark
What is it called when a consumer’s marginal utility is greater than the price paid for the good?
Aa Giffen good
Ban inferior good
Cconsumer surplus
Dproducer surplus
Show answer
CCorrect answer
Question 6Feb/March 20269708/321 mark
Show answer
BCorrect answer
Question 7Feb/March 20269708/321 mark
Show answer
DCorrect answer
Question 1Oct/Nov 20259708/311 mark
What is likely to lead to the principal-agent problem?
Aa manager of a business makes decisions on behalf of the owner
Bmusic festival tickets are purchased by a person who intends to sell them at a large profit
Cthe government is the only buyer of a pharmaceutical product
Dthere is only one firm that manufactures the product
Show answer
ACorrect answer
Question 2Oct/Nov 20259708/311 mark
Show answer
ACorrect answer
Question 3Oct/Nov 20259708/311 mark
Show answer
CCorrect answer
Question 4Oct/Nov 20259708/311 mark
A consumer maximises his total utility by initially buying 10 units of good X and 10 units of good Y. Assuming both goods are normal, what would cause this utility-maximising consumer to purchase more of good Y and less of good X?
Aan increase in the marginal utility of good Y
Ban increase in the price of good Y
Can increase in the tax on the consumption of good Y
Dan increase in the tax on the income of consumers
Show answer
ACorrect answer
Question 5Oct/Nov 20259708/311 mark
What is most likely to lead to a Pareto-optimal outcome?
Aoffering bulk-buy discounts to customers who join a loyalty scheme
Bswitching labour from producing low-priced products to producing high-priced products
Cswitching production from labour-intensive products to capital-intensive products
Dtraining low-skilled workers to operate machinery effectively
Show answer
DCorrect answer
Question 6Oct/Nov 20259708/311 mark
Show answer
ACorrect answer
Question 7Oct/Nov 20259708/311 mark
Show answer
DCorrect answer
Question 8Oct/Nov 20259708/311 mark
Show answer
DCorrect answer
Question 1Oct/Nov 20259708/321 mark
What is the definition of moral hazard?
AAn increase in the likelihood of taking risks because another party is paying for these risks.
BThe loss of social welfare arising from the consumption of a good.
CWhen buyers and sellers have different amounts of information regarding product quality.
DWhen costs and benefits are taken into account when a decision is being made.
Show answer
ACorrect answer
Question 2Oct/Nov 20259708/321 mark
Show answer
DCorrect answer
Question 3Oct/Nov 20259708/321 mark
Show answer
CCorrect answer
Question 4Oct/Nov 20259708/321 mark
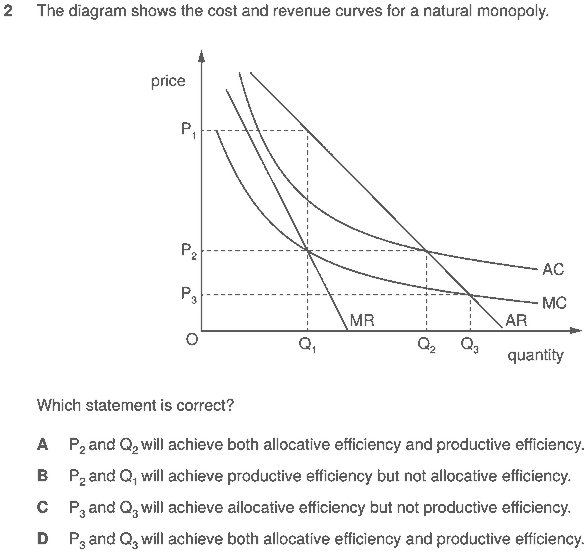
A firm has very high fixed costs but low marginal costs of production. It experiences continuous economies of scale so that the minimum efficient scale is not reached until the firm is very large in relation to total market demand. In which type of market structure would the firm operate?
Amonopolistic competition
Bmonopsony
Cnatural monopoly
Doligopoly
Show answer
CCorrect answer
Question 5Oct/Nov 20259708/321 mark
Show answer
CCorrect answer
Question 6Oct/Nov 20259708/321 mark
An economist undertakes a cost–benefit analysis of the pollution resulting from a manufacturing process. Which outcome is most likely to guide any recommendation about the optimal level of manufacturing output?
Athat the marginal social cost of manufacturing equals the marginal social benefit
Bthat the marginal cost of pollution is zero
Cthat the total revenue of manufacturing equals the total cost
Dthat the total benefit of pollution is maximised
Show answer
ACorrect answer
Question 7Oct/Nov 20259708/321 mark
Show answer
DCorrect answer
Question 8Oct/Nov 20259708/321 mark
What might help achieve allocative efficiency?
Adifferentiated products
Bgovernment subsidies
Cmonopsony
Dsupernormal profits
Show answer
BCorrect answer
Question 1Oct/Nov 20259708/331 mark
Why would an economy wish to achieve economic efficiency?
Ato achieve an equal distribution of income
Bto achieve full employment
Cto ensure resources are not wasted
Dto ensure international competitiveness
Show answer
CCorrect answer
Question 2Oct/Nov 20259708/331 mark
A firm has set a low price in the short run to act as a barrier to entry for new firms entering the market. This is an example of which pricing strategy?
Alimit pricing
Bpredatory pricing
Cprice discrimination
Dprice leadership
Show answer
ACorrect answer
Question 3Oct/Nov 20259708/331 mark
A dentist is found to have charged patients for treatment they did not need. What is the likely cause of this market failure?
Aa minimum price
Basymmetric information
Cnon-excludability
Dproductive inefficiency
Show answer
BCorrect answer
Question 4Oct/Nov 20259708/331 mark
Show answer
DCorrect answer
Question 5Oct/Nov 20259708/331 mark
Show answer
DCorrect answer
Question 6Oct/Nov 20259708/331 mark
(Question image not available.)
Show answer
CCorrect answer
Question 7Oct/Nov 20259708/331 mark
Show answer
CCorrect answer
Question 8Oct/Nov 20259708/331 mark
Assuming there are no externalities, where would a nationalised firm set output to maximise social welfare?
Awhere average revenue equals average cost
Bwhere average revenue equals marginal cost
Cwhere marginal revenue equals marginal cost
Dwhere marginal revenue is zero
Show answer
BCorrect answer
Question 1Oct/Nov 20259708/341 mark
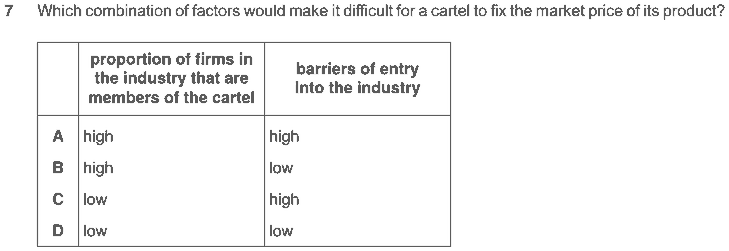
What will act as a barrier to collusion between firms?
Aan ability to detect price cuts by rivals
Bthe abolition of anti-trust measures
Cthe existence of a small number of firms in the industry
Dunstable demand conditions for products
Show answer
DCorrect answer
Question 2Oct/Nov 20259708/341 mark
Show answer
CCorrect answer
Question 3Oct/Nov 20259708/341 mark
What is an example of forward vertical integration?
AA firm manufacturing computers merges with a firm that manufactures furniture.
BA firm manufacturing computers merges with a firm that manufactures silicon chips for computers.
CA firm manufacturing computers merges with a retail outlet that sells computers.
DA firm manufacturing computers merges with another firm that also manufactures computers.
Show answer
CCorrect answer
Question 4Oct/Nov 20259708/341 mark
Show answer
BCorrect answer
Question 5Oct/Nov 20259708/341 mark
A firm has fixed costs of $300 and can produce two units per hour. Its total variable costs are $200 for one unit and $300 for two units. Which cost will fall by the lowest amount when the second unit is produced?
Aaverage fixed cost
Baverage total cost
Caverage variable cost
Dmarginal cost
Show answer
CCorrect answer
Question 6Oct/Nov 20259708/341 mark
What is the most likely evidence that an economy has reached a position of Pareto optimality?
Aprice volatility
Ba large current account deficit
Ca regressive taxation system
Dfull employment
Show answer
DCorrect answer
Question 7Oct/Nov 20259708/341 mark
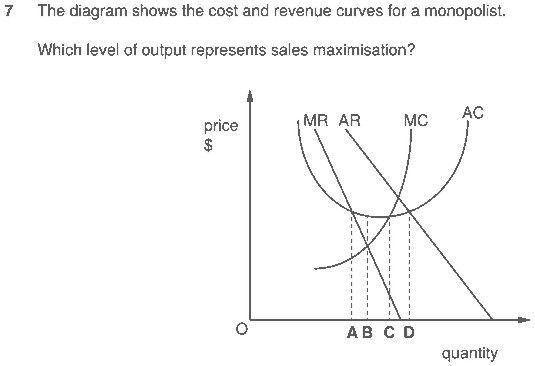
A firm is operating at a level of output which corresponds to the point where MR = 0. What objective is the firm achieving?
Amaximising consumer surplus
Bmaximising profit
Cmaximising sales
Dmaximising revenue
Show answer
DCorrect answer
Question 1May/June 20259708/311 mark
What is the equi-marginal principle?
AAs consumption of a product increases, the satisfaction from consumption of the product decreases by an equal amount.
BConsumers maximise utility where their marginal valuation for each product consumed is the same.
CThe total satisfaction received by consumers from consumption of a product is constant.
DThe marginal utility derived by consumers from the consumption of one more unit of a product is constant.
Show answer
BCorrect answer
Question 2May/June 20259708/311 mark
Show answer
CCorrect answer
Question 3May/June 20259708/311 mark
What would not affect the budget line of an individual consumer?
Athe individual’s preference for various goods
Bthe level of income tax
Cthe money prices of goods
Dthe incomes earned by the individual
Show answer
ACorrect answer
Question 4May/June 20259708/311 mark
Show answer
CCorrect answer
Question 5May/June 20259708/311 mark
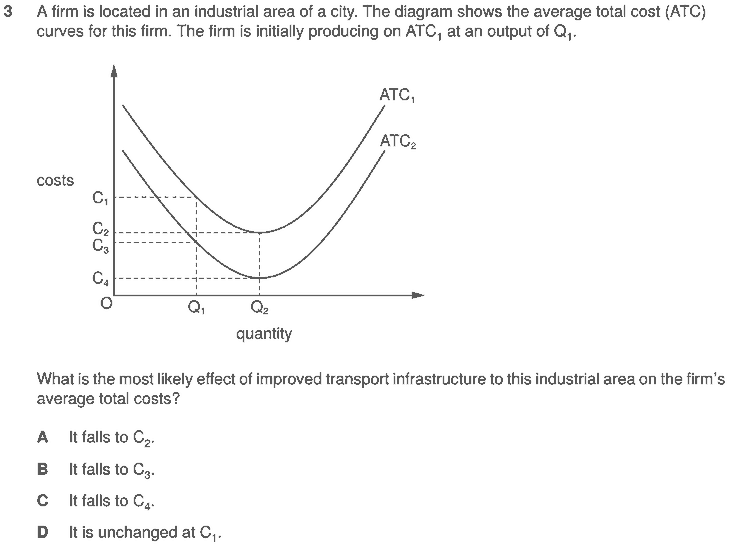
What is an internal economy of scale?
Aefficient local transport networks
Bimproved access to spare parts as a result of industry growth
Clower risks from supplying a wider range of customers
Dthe training of skilled labour at a college financed by local firms
Show answer
CCorrect answer
Question 6May/June 20259708/311 mark
Show answer
DCorrect answer
Question 7May/June 20259708/311 mark
Show answer
CCorrect answer
Question 1May/June 20259708/321 mark
Show answer
CCorrect answer
Question 2May/June 20259708/321 mark
When is allocative efficiency achieved?
Awhen a perfectly competitive market is in equilibrium
Bwhen everybody who needs the product can obtain it
Cwhen firms produce at the lowest possible cost
Dwhen monopolistic firms make normal profits
Show answer
ACorrect answer
Question 3May/June 20259708/321 mark
Show answer
BCorrect answer
Question 4May/June 20259708/321 mark
When might a moral hazard occur?
AWhen a consumer does not have full information about a product.
BWhen a person undertakes an activity that causes harm to another person.
CWhen a person undertakes a risky activity, knowing another person bears the risk.
DWhen the seller of a product has more information than the buyer.
Show answer
CCorrect answer
Question 5May/June 20259708/321 mark
Show answer
CCorrect answer
Question 6May/June 20259708/321 mark
What would enable a firm to increase its market share in a monopolistically competitive market?
Abarriers to entry
Bcollusion
Clack of competition
Dsuccessful advertising
Show answer
DCorrect answer
Question 7May/June 20259708/321 mark
Two manufacturing firms in the same industry, producing similar products, are considering merging together. What would be the least convincing reason for merging?
AIt would enable greater bargaining power when buying raw materials.
BIt would enable technical economies of scale.
CIt would produce savings in management and administration costs.
DIt would reduce the dependence of the firms on the suppliers of raw materials.
Show answer
DCorrect answer
Question 8May/June 20259708/321 mark
The marginal social benefit of consuming a drink is less than the marginal private benefit. What would be the best policy to improve resource allocation in this market?
Agive a subsidy to the producers of the drink
Bincrease competition in the drink industry
Cimpose a maximum price for the drink above the market equilibrium price
Dimpose a per unit tax on the drink
Show answer
DCorrect answer
Question 1May/June 20259708/341 mark
Show answer
CCorrect answer
Question 2May/June 20259708/341 mark
Show answer
BCorrect answer
Question 3May/June 20259708/341 mark
Why does the lack of property rights cause an inefficient allocation of resources?
AScarce resources are depleted because the owner has sold them too cheaply.
BScarce resources are depleted because they had zero cost to the users.
CScarce resources are under-allocated to the provision of demerit goods.
DScarce resources are under-allocated to the provision of merit goods.
Show answer
BCorrect answer
Question 4May/June 20259708/341 mark
A cost–benefit analysis is carried out on the construction of a hydroelectric power station. Under which circumstances would the scheme be most likely to be approved?
APrivate benefits are greater than private costs.
BSocial benefits are greater than social costs.
CSocial benefits are greater than external costs.
DExternal costs are greater than external benefits.
Show answer
BCorrect answer
Question 5May/June 20259708/341 mark
Which type of market structure enables price leadership to take place?
Amonopolistic competition
Boligopoly
Cperfect competition
Dpure monopoly
Show answer
BCorrect answer
Question 6May/June 20259708/341 mark
Show answer
BCorrect answer
Question 7May/June 20259708/341 mark
Show answer
BCorrect answer
Question 10May/June 20259708/341 mark
Which policy by a government would increase the negative externalities that result from cigarette smoking?
Aa ban on cigarette advertising
Ba ban on cigarette smoking in public places
Ca ban on substitutes for cigarettes
Da ban on the sale of cigarettes
Show answer
CCorrect answer
Question 1Feb/March 20259708/321 mark
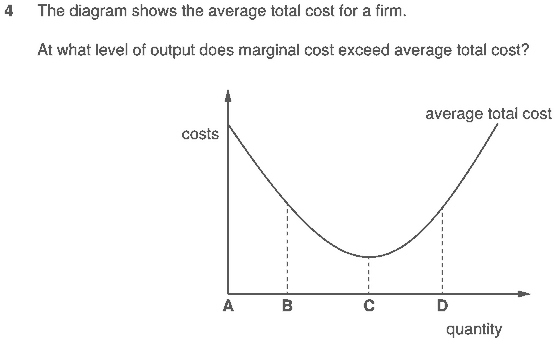
Which cost will continually decrease as a firm’s output increases in the short run?
Aaverage cost
Baverage fixed cost
Caverage variable cost
Dmarginal cost
Show answer
BCorrect answer
Question 2Feb/March 20259708/321 mark
What is an example of market failure?
Aa firm incurring a loss by selling goods at prices below the average cost
Ba guaranteed price that results in the accumulation of unsold stocks
Clow income earners being unable to buy high-priced goods
Dunder-provision of a socially desirable good
Show answer
DCorrect answer
Question 3Feb/March 20259708/321 mark
What is likely to prevent the development of an effective cartel in an industry?
Aa high concentration ratio
Ba limit-pricing policy
Chigh fixed costs
Dlow barriers to entry
Show answer
DCorrect answer
Question 4Feb/March 20259708/321 mark
Show answer
BCorrect answer
Question 5Feb/March 20259708/321 mark
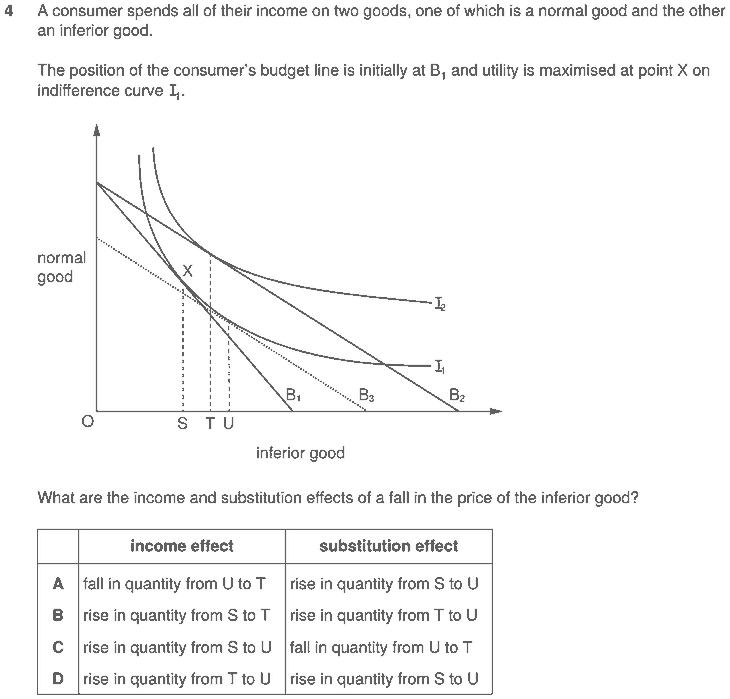
Which statement about the downward sloping demand curve of an inferior good is correct?
ANegative income effect and substitution effect move in opposite directions, leading to a
BNegative income effect and substitution effect move in the same direction, leading to a flatter
CPositive income effect and substitution effect move in opposite directions, leading to a
DPositive income effect and substitution effect move in the same direction, leading to a flatter
Show answer
ACorrect answer
Question 6Feb/March 20259708/321 mark
Show answer
CCorrect answer
Question 7Feb/March 20259708/321 mark
Show answer
BCorrect answer
Paper 4 · Data response and essays (29)
Question 2May/June 20269708/4120 marks
2 With the help of a diagram(s), assess the view that larger firms always have lower average costs than smaller firms. [20]
Show mark scheme
With the help of a diagram(s), assess the view that larger firms always have lower average costs than smaller firms.
Use Table A: AO1 Knowledge and understanding and AO2 Analysis and Table B: AO3 Evaluation to mark candidate responses to this question.
AO1 and AO2 out of 8 marks. AO3 out of 4 marks.
Indicative Content
AO1 Knowledge and understanding and AO2 Analysis Relevant diagram(s) Students may draw a long-run average cost (LRAC) curve showing economies and diseconomies of scale. Long-run average costs and firm size Illustrates economies and diseconomies of scale.
Diagram should show:
Falling LRAC due to economies of scale.
Minimum efficient scale (MES).
Rising LRAC beyond the optimum due to diseconomies of scale.
Maximum Level 2 if no diagram
Knowledge and Understanding
Definition of average cost.
Understanding of economies of scale and diseconomies of scale.
Understanding of minimum efficient scale (MES).
Recognition that firm size may affect costs.
Analysis
Candidates may explain:
Larger firms can benefit from:
Purchasing economies.
Technical economies.
Financial economies.
Marketing economies.
Managerial economies.
Risk-bearing economies.
These economies lower average costs as output rises.
Larger firms may spread fixed costs over a greater level of output, reducing average costs.
However, as firms continue to grow:
Communication problems may arise.
Coordination becomes more difficult.
Bureaucracy may increase.
Worker motivation may fall.
These diseconomies of scale can raise average costs.
Some industries have a relatively low MES, meaning small firms can operate efficiently despite being smaller. Modern technology may reduce the advantages of large-scale production, allowing smaller firms to remain competitive. Indicative Analytical Chains Chain 1 Large firm → technical economies → higher productivity → lower unit costs → lower average costs. Chain 2 Firm expands excessively → management layers increase → communication failures → inefficiency → higher average costs. Minimum of three developed points for Level 3
AO3 Evaluation (6 marks)
Award up to 6 marks for evaluation. Possible evaluative points: The statement uses the word ‘always’. This is unlikely to be correct because diseconomies of scale may emerge once a firm becomes too large. The importance of firm size depends on the industry:
Industries such as car manufacturing may have substantial economies of scale.
Sectors such as consultancy, software development or specialist services may allow smaller firms to compete effectively.
The extent of cost advantages depends on technology.
Digital technologies and outsourcing can reduce the need for large-scale operations. Some firms deliberately remain small to maintain flexibility, innovation or customer service, which may offset higher costs. A distinction can be made between:
Larger firms having the potential for lower average costs.
Larger firms actually achieving lower average costs in practice. E6 (Highest-level Judgement) A justified conclusion such as: Larger firms often achieve lower average costs because of economies of scale, particularly up to the minimum efficient scale. However, it is incorrect to argue that they always have lower average costs since diseconomies of scale, industry characteristics and technological developments may enable smaller firms to be equally or more cost-efficient.
Accept all valid responses.
AO1 Knowledge and understanding and AO2 Analysis
AO3 Evaluation
Question 3May/June 20269708/4120 marks
3 Third-degree price discrimination benefits the firm but not its customers.
With the help of a diagram, assess the consequences of third-degree price discrimination to both the firm and its customers. [20]
Show mark scheme
Third-degree price discrimination benefits the firm but not its customers. With the help of a diagram, assess the consequences of third-degree price discrimination to both the firm and its customers.
Use Table A: AO1 Knowledge and understanding and AO2 Analysis and Table B: AO3 Evaluation to mark candidate responses to this question.
AO1 and AO2 out of 8 marks. AO3 out of 4 marks.
Indicative content Responses may include:
AO1 Knowledge and understanding and AO2 Analysis
Third degree price discrimination will lead to some consumers losing their consumer surplus since they are paying higher prices that they would without price discrimination.
Consumers who are charged the higher prices may feel unfairly treated, leading to dissatisfaction and potential backlash against the firm.
Firms segment the market based on observable characteristics such as age, location, or income level, and charge different prices to each segment, leading to higher revenues than just a single uniform price.
Third-degree price discrimination will enable firms to get higher supernormal profits.
Higher profits by firms enable more reinvestments of profits which could lead to capturing further market share and entrance into new markets.
Analysis of the price discrimination diagram.
AO3 Evaluation
To price discriminate, firms need to accurately identify each consumer's willingness to pay, which may require costly information gathering and segmentation strategies, and the cost may outweigh the benefits.
Higher levels of innovation by firms making more profits could provide consumers with more choices and better-quality products
Some consumers will be charged lower prices and therefore get higher satisfaction – increasing accessibility of the product.
Accept all valid responses.
AO1 Knowledge and understanding and AO2 Analysis
AO3 Evaluation
Question 2May/June 20269708/4220 marks
2 Evaluate whether the marginal utility theory of demand provides an adequate explanation of market demand for both normal goods and inferior goods. [20]
Show mark scheme
Evaluate whether the marginal utility theory of demand provides an adequate explanation of market demand for both normal goods and inferior goods. Use TableA: AO1 Knowledge and understanding and AO2 Analysis and Table B: AO3 Evaluation to mark candidate responses to thisquestion.
AO1 and AO2 out of 14marks. AO3 out of 6 marks.
Indicative content Responses may include:
AO1 Knowledge and understanding and AO2 Analysis
Assumptions of marginal utility analysis including:
rational consumers who prefer more to less,
a two-good world,
the goods can be substituted for each other,
perfect knowledge of the market.
Definition of marginal and total utility.
Explanation of diminishing marginal utility.
The analysis of the change in the price of a good and the explanation of how much the consumer will purchase as the price changes.
The use of the equi-marginal principle to establish how consumers ‘balance’ their expenditure on goods as the price of one of them changes. MU /P = MU /P x x y y
The horizontal addition of individuals’ demand curves to achieve the market demand curve.
AO3 Evaluation
Consumer rationality: marginal utility theory assumes that consumers act rationally. They are of a calculating mind, carrying numerous combinations of different commodities in their heads, can substitute one for the other, compare their total utilities and make a rational choice between various combinations of goods.
Marginal utility theory has no provision for income and substitution effects so does not explain inferior goods.
It is difficult to compare the concept of changing the demand for expensive goods which are purchased infrequently with goods such as consumables. which are one-off indivisible purchases and the choice is between, for example, 1 fridge and 4 weeks’ food.
A consumer is faced with a much more complex world than the two-good world of the model because a consumer buys not just two but many commodities to satisfy their innumerable wants.
Accept all valid responses.
AO1 Knowledge and understanding and AO2Analysis
AO3 Evaluation
Case study: Environmental policies in Czechia
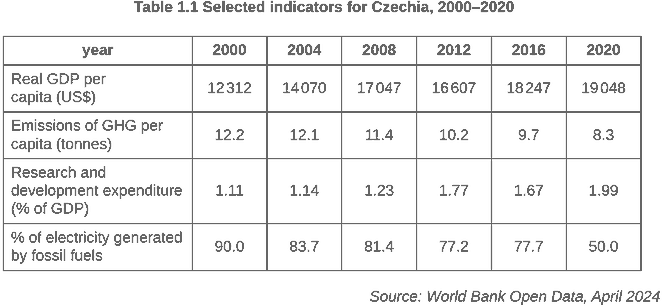
Czechia, a country in the European Union, is experiencing strong growth of its gross domestic product (GDP). Climate change, however, is affecting its agriculture and forestry sectors and people’s health. According to Table 1.1, Czechia currently generates 50% of its electricity using fossil fuels (coal, oil, and gas), which emit greenhouse gases (GHG) and other air pollutants. Nuclear power plants generate 32% and renewable sources generate 18%. Czechia also has coal‑fuelled heating systems, and industry that emits a lot of GHG, particularly in car production. Despite an increase in the use of renewables and energy efficiency measures, Czechia remains highly dependent on fossil fuels. If Czechia is to reach net zero carbon emissions by 2050, further measures are needed.
Czechia’s relatively low research and development (R&D) spending in the private sector is shown in Table 1.1. Combined with inadequate digital and transport infrastructure, this restricts innovation. However, energy efficiency regulations, such as setting energy efficiency standards for buildings, will incentivise private investment. Increased government spending on renewable energy projects and energy efficiency measures, such as modernising electricity grids, would act as a fiscal injection. There is not enough skilled labour at present to install new technologies in the renewable energy sector, but education and training can be improved.
The government needs to ensure that energy prices do not rise too much, which would add to firms’ costs. If Czechia fulfils its commitment to phase out the use of coal to generate electricity by 2033, the high levels of unemployment and poverty in Czechia’s coal‑producing region could increase.
Since 2000, transport’s use of energy has increased by 64%. As incomes have grown, the use of public transport, such as rail and buses, has decreased from 37% to 18% of all passenger kilometres travelled, while the use of private cars has increased from 63% to 82%. Therefore, policies to improve the quality and availability of public transport are needed. Increasing investment in public transport would also promote worker mobility and productivity growth.
Higher taxes on cars and electricity would raise revenues that could partly finance environmental projects. The structure of vehicle taxes in Czechia encourages the use of hybrid and electric cars, for example electric‑car owners are exempt from road tax and can park for free in cities. But further measures to facilitate the use of electric vehicles, such as providing charging infrastructure, are necessary.
Sources: International Monetary Fund : Enhancing the green transition in Czechia Odysee Mure: European Union: Czechia : Energy profile, March 2024
Question 1(b)May/June 20269708/444 marks
(b) Goods can be classified as either normal or inferior.
(i) Explain how public transport would be classified in Czechia. [2]
(ii) Explain how private cars would be classified in Czechia. [2]
Show mark scheme
Goods can be classified as either normal or inferior.
Explain how public transport would be classified in Czechia.
Use of bus and rail travel appears to be declining as incomes rise (1)
They are not normal goods/they are inferior goods (1) Explain how private cars would be classified in Czechia.
Use of private cars appears to be increasing as incomes rise (1)
They are normal goods/they are not inferior goods (1)
Question 1(c)May/June 20269708/446 marks
(c) Consider, with the help of a diagram, whether electricity generation in Czechia creates a deadweight welfare loss. [6]
Show mark scheme
Consider, with the help of a diagram, whether electricity generation in Czechia creates a deadweight welfare loss.
Diagram, with axes (1) and curves correctly labelled (1)
Diagram, with DWL appropriately indicated/identification DWL in the text
(1)
Diagram is worth (3) marks in total
Electricity generation has negative production externalities/external costs
(1)
Marginal social cost is greater than/above marginal private cost/supply curve (1)
MSC does not equal MSB at the (market) outcome (1)
Market outcome is too high/overallocation of production (1)
There is market failure (1) Discussion is worth (3) marks in total
Question 2May/June 20269708/4420 marks
2 Assess the extent to which marginal utility theory explains the downward sloping market demand curve for a good. [20]
Show mark scheme
Assess the extent to which marginal utility theory explains the downward sloping market demand curve for a good.
Use Table A: AO1 Knowledge and understanding and AO2 Analysis and Table B: AO3 Evaluation to mark candidate responses to this question.
AO1 and AO2 out of 14 marks. AO3 out of 6 marks.
Indicative content Responses may include:
AO1 Knowledge and understanding and AO2 Analysis
Definition of marginal utility/total utility and their relationship.
Explanation of diminishing marginal utility.
Analysis of the equi-marginal principle to show how change in price affects the quantity demanded for an individual’s demand curve.
Explanation and analysis to show a market demand curve stating/showing the horizontal summation of the individuals demand curves.
AO3 Evaluation
Not possible to measure utility.
Assumes that consumers are rational, but there may be cases where expensive goods are consumed in order for the consumer to be conspicuous.
There may be Giffen goods.
Assumes perfect knowledge of prices for substitutes.
Many choices between two goods occur when they are not easily substitutable for each other.
Consumer preferences change over time.
The use of indifference curves to analyse demand may be more effective.
Collection of sets might mean utility increases as the sets near completion.
Accept all valid responses.
AO1 Knowledge and understanding and AO2 Analysis
AO3 Evaluation
Question 3May/June 20269708/4420 marks
3 Although firms in an oligopolistic market may be in competition with each other, they will find it advantageous to collude.
With the help of a diagram or a pay‑off matrix, evaluate this statement. [20]
Show mark scheme
Although firms in an oligopolistic market may be in competition with each other, they will find it advantageous to collude. With the help of a diagram or a pay-off matrix, evaluate this statement.
Use Table A: AO1 Knowledge and understanding and AO2 Analysis and Table B: AO3 Evaluation to mark candidate responses to this question.
AO1 and AO2 out of 14 marks. AO3 out of 6 marks.
Indicative content Responses may include:
AO1 Knowledge and understanding and AO2 Analysis
Explanation of an oligopolistic market, with reference to the concentration ratio.
An explanation of different types of collusion, such as tacit collusion, price- leadership, cartels.
An explanation of how the firms are interdependent/consider other firms’ possible reactions when making pricing or output or other decisions.
Explanation of how the kinked demand price set by price leadership
Analysis of the kinked demand curve diagram and/or the payoff matrix.
Payoff matrix analysis used to explain why collusion takes place.
An explanation of how price ‘wars’ might occur.
Analysis of a ‘monopoly’ diagram for the joint output and price when firms collude.
Analysis of non-price/price competition.
AO3 Evaluation
Collusive agreements are likely to break down, when firms act to maximize their own profits.
Collusive agreements may infringe government regulations which are aimed at increasing competition.
Cartels would need to be approved by a government agency.
Both the kinked demand curve model and the pay-off matrix depend upon a particular set of assumptions about firms’ behavior, which may not occur in the real world.
Accept all valid responses.
AO1 Knowledge and understanding and AO2 Analysis
AO3 Evaluation
Question 2Feb/March 20269708/4220 marks
2 Training workers improves their human capital and increases productivity. This benefits the workers, their employers and the government.
Consider the extent to which training should be paid for only by workers. [20]
Show mark scheme
Training workers improves their human capital and increases productivity. This benefits the workers, their employers and government. Consider the extent to which training fees should be paid for only by workers. Use TableA: AO1 Knowledge and understanding and AO2 Analysis and Table B: AO3 Evaluation to mark candidate responses this question.
AO1 and AO2 out of 14marks. AO3 out of 6 marks.
Indicative Content: Responses may include:
AO1 Knowledge and Understanding and AO2 Analysis
Differences between education and training might be explained.
Trained workers are likely to have higher productivity and this will increase the demand for this labour
For workers, higher demand for skilled labour is likely to lead to higher wages.
MRP theory might be used in conjunction with a supply of and demand for labour diagram, to illustrate the impact on wages of an increase in productivity
For workers, highly skilled labour is more likely to produce an inelastic supply and therefore increase wages.
Employers might pay fees because they are likely to benefit through an increase in profits.
Government’s might contribute towards fees because they are likely to benefit in the long run due to an increase in real GDP
AO3 Evaluation
Wealthier families can afford to pay.
Fear of significant debt for lower paid individuals.
Government funding might lead to less well-off workers subsiding those benefiting from government financial support
low paid workers may not be able to cover self-financing their fees.
Workers may be subsequently employed by other firms who do not bear the initial costs.
Government funding of fees for some groups at the expense of others may be politically unpopular.
Accept all valid responses.
AO1 Knowledge and understanding and AO2 Analysis
AO3 Evaluation
Question 3Feb/March 20269708/4220 marks
3 The fashion industry employs around 75 million workers, many of whom earn very low wages and work up to 16 hours a day. The industry contributes to 20% of global wastewater and 8% of all carbon emissions. 60% of clothes are made from plastics, 83 million tonnes of the 100 billion garments produced are sent to landfill, and only 20% are collected for recycling.
Consider to what extent an equitable solution can be found for market failures in the fashion industry. [20]
Show mark scheme
The fashion industry employs around 75 million workers, many of whom earn very low wages and work up to 16 hours a day. The industry contributes to 20% of global wastewater and 8% of all carbon emissions. 60% of clothes are made from plastics, 83 million tonnes of the 100 billion garments produced are sent to landfill, and only 20% are collected for recycling. Consider to what extent an equitable solution can be found for market failures in the fashion industry.
Use Table A: AO1 Knowledge and Understanding, AO2 Analysis, and Table B: AO3 Evaluation, to mark candidate responses to this question
AO1 and AO2 are out of 14 marks. AO3 is out of 6 marks.
Indicative Content Responses may include:
AO1 Knowledge and Understanding and AO2 Analysis
definition of market failure/allocative inefficiency
explanation and example of a negative externality of production
might draw a diagram to illustrate the link between negative externality of production and market failure
the use of indirect taxation could be used to reduce the output of fashion clothes/the subsequent cost of the tax would be shared between consumers and producers
use of advertising and education to raise public awareness of the negative impact of the production of fashion clothes upon society
the provision of subsidies to those producers who use less plastic
increase the cost of using landfill sites
AO3 Evaluation
the use of indirect taxation might lead to unemployment in the fashion industry
the use of indirect taxation might have a negative effect upon the export of fashion goods
subsidies are costly and will lead to a re-distribution of income within the economy
the rising cost of using landfill sites might lead to illegal dumping of waste products
Accept all valid responses
AO1 Knowledge and understanding and AO2 Analysis
AO3 Evaluation
Question 2Oct/Nov 20259708/4120 marks
2 Market failure is to blame for climate change and the inefficient allocation of resources. The only solution is for governments to intervene to improve resource allocation.
Assess the extent to which you agree with this statement. [20]
Show mark scheme
Market failure is to blame for climate change and the inefficient allocation of resources. The only solution is for governments to intervene to improve resource allocation. Assess the extent to which you agree with this statement
AO1 Knowledge and understanding and AO2 Analysis
Climate change can be regarded as a form of market failure can be explained by linking this to the requirement to allocate resources to maximise consumer satisfaction. This can be supported by a diagram illustrating a level of output where AR = MC or MSB = MSC which is consistent with an outcome that achieves allocative efficiency.
Negative externalities occur when the consumption/use of a good produces a cost to society which is greater than that received by an individual producer MPB ⩾ MSB or MSC ⩾MPC. This is sometimes described as a negative ‘spill-over’ effect. The negative externality leads to an over production of the good carbon dioxide or other greenhouse gas.
Government intervention takes place to address the failure of market forces to allocate resources efficiently. In this case positive externalities would lead to under–consumption of a good or service.
Different types of government intervention can be used to correct the under-production of output to enable consumer satisfaction to be maximised.
Forms of government intervention might include: the use of subsidies for consumers to move to less polluting forms of consumption and also producers to change productionmethods, use of positive advertising; the direct provision of goods and services such as alternative transport methods. Alternatively indirect taxation might be applied to the CO 2 producing source. Nudge theory effects.
A clearly labelled, accurate diagram can be used to show the impact of a positive/negative externality on the level of outputand the welfare change will be identified.
The diagram could show the market equilibriumpoint which does not take into account the existence of anegative consumption externality and may compare this with the allocatively efficient level of output when the negative externality is taken into account. The diagram may be amended or re-drawn to show the impact of achosen policy(ies) and the impact on consumption or production shown.
Reference to the diagram and the outcomes it illustrates is made in the text.
AO3 Evaluation
A government might introduce a subsidy to encourage producers to increase output to enable allocative efficiency, however it is difficult to measure the precise valueof the subsidy. Subsidies are costly in that the funds might have been used by governments for other purposes. This means governments will have to make a value judgement when deciding whether to provide a subsidy. Thereare opportunity costs of the subsidy.
Also, the impact on price and output in some circumstances takes a long time to become effective.
Advertising is often costly and it is not always certain that it will have a sufficiently persuasive effect to ensure the correct level of output/ consumption is reached.
Direct provision is also costly and sometimes less efficient than that provided through market forces.
It is possible to show that government intervention can reduce the level of inefficiency caused by the existence of positive externalities but it is not clear whether the net effect of government intervention will always be positive. Some types of intervention will be more effective than others depending on the nature of the good/service under consideration.
Government failure. Concluding point which considers ‘only’ aspect.
Accept all valid responses.
AO1 Knowledge and understanding and AO2Analysis
AO3 Evaluation
Question 3Oct/Nov 20259708/4120 marks
3 The degree of competition that a firm experiences is determined only by the barriers to entry into its market.
With the help of a diagram(s), evaluate this statement. [20]
Show mark scheme
The degree of competition a firmexperiencesis determined only by the barriers to entry into its market. With the aid of diagrams, evaluate this statement. Use TableA:AO1 Knowledge and understanding andAO2 Analysis and Table B: AO3 Evaluation to mark candidate responses to this question.
AO1 and AO2 out of 14 marks. AO3 out of 6 marks.
Indicative content Responses may include:
AO1 Knowledge and understanding and AO2 Analysis
A discussion of types of barriers to entry.
The impact of barriers to entry on market structures.
A detailed analysis of at least 2 forms of market structure one with no barriers (perfect competition or monopolistic competition) and one with barriers to entry (oligopoly or monopoly) to include reference to product, knowledge levels, profit levels.
Diagrams are correctly labelled and accurately drawn.
with correct labelling and relevant reference to it/them in the answer.
Max L2 if no diagram
Max L2 if only one type of structure
AO3 Evaluation
Competition is linked to the number of firms who can access a market, so the simple answer is yes because barriers to entry preventfirms entering a market.
Perfect competition and monopolistic competition with their lack of barriers are both highly competitive.
Competition takes place in oligopoly through product differentiation and sales and marketing.
Monopolies are subject to limitations on their ability to exploit the consumer by the limitations of contestable markets.
Regulation
Accept all valid responses
Case study: Resources in Brazil
Between 2000 and 2020, Brazilian GDP, measured in US dollars ($), rose from $1.19 trillion to $1.89 trillion at constant prices (2015). In the same period GDP per head rose from $6745 to $8204 at constant prices (2015).
The strength of the Brazilian economy lies in the variety and quantity of its natural resources. For example, Brazil is one of the world’s largest exporters of agricultural commodities, mainly soya and beef. There are also significant exports of minerals. Brazil is the second largest iron ore producer in the world and extracts 3.4% of the world’s crude oil.
World agricultural markets are dominated by four large commodity traders that buy and sell products such as grain and soya. They have grown through both horizontal integration and vertical integration. These traders own many large farms, they process farm produce and transport it to trade on international markets. In addition to buying and selling, the traders provide seed and fertiliser to farmers and supply storage for their products. They use agricultural by-products to produce items like biofuel. These traders also provide financial services to these markets.
Commodity traders are very important to the development of complex global food markets. Food prices, access to scarce resources such as land and water, climate change and food security are all affected by the activities of traders. In Brazil, the output of 15 000 farmers is purchased by a single trader.
In Brazil the development of agriculture, mining and oil extraction all contribute to environmental degradation. Both agriculture and mining have been accompanied by deforestation of the Amazon rainforest. Access roads to mining areas also lead to deforestation. Waste water from mining activity is frequently stored in reservoirs behind dams. On two occasions in the last 10 years these dams failed to hold back the water. This led to widespread flooding, the discharge of pollutants such as mercury into rivers, and deaths.
Sources: The Guardian, 23 August 2022
Cereal Secrets, Oxfam Research Report, August 2012 oec.world/en/profile, August 2023
Question 1(b)Oct/Nov 20259708/424 marks
(b) Explain one possible benefit of horizontal integration and one possible benefit of vertical integration. [4]
Show mark scheme
Explain one possible benefit ofhorizontal integration and one possible benefit of vertical integration. Horizontal integration definition (1) + Benefit (1) Vertical integration definition (1) + Benefit (1)
Question 1(c)Oct/Nov 20259708/426 marks
(c) Describe how the market structure in which individual farmers operate is likely to differ from the market structure in which the commodity traders operate. [6]
Show mark scheme
Describe how the market structure in which individual farmers operate is likely to differ from the market structure in which the commodity traders operate. Farmers: monopolisticcompetition (1) many sellers (1), similar product (1), no barriers to entry (1), price maker (1) Max 3 Traders: oligopoly(1) and a few sellers (4) (1) and barriers to entry (1) price maker (1) product differentiation (1) Max 3 Market structure must be correct to gain explanation marks.
Question 2Oct/Nov 20259708/4220 marks
2 Traffic congestion is a cause of allocative inefficiency.
Evaluate, with the help of diagram(s) two policies that a government may introduce to reduce the problem of allocative inefficiency caused by traffic congestion. [20]
Show mark scheme
Traffic congestion is a cause of allocative inefficiency. Evaluate, with the help of diagram(s) two policies that a government may introduce to reduce the problem of allocative inefficiency caused by traffic congestion.
AO1 Knowledge and understanding and AO2 Analysis
Market failure regarding this question would relate to allocative inefficiency. Market failure can be explained by defining allocative efficiency and linking this to the requirement to allocate resources to maximise consumer satisfaction. This can be supported by a diagram illustrating a level of output where AR = MC or MSB = MSC which is consistent with an outcome that achieves allocative efficiency.
Negative externalities occur when the consumption/use of agood produces a cost to society which is greater than that received by an individual consumer MPB > MSB. This is sometimesdescribed as a negative ‘spill-over’ effect. The negative externality leads to an over production of the good.
Government intervention takes place to address the failure of market forces to allocate resources efficiently.
Different types of governmentinterventioncan be used to correct the over consumption to enable consumer satisfaction to be maximised.
Forms of government intervention might include: the use of subsidies for consumers to increase consumption of alternative forms of transport, use of positive advertising of alternatives; the direct provision of goods and services such as alternative transport methods. Indirect taxation. Nudge theory effects.
Aclearly labelled, accurate diagram can be used to show the impact of a negative externality on the level of output and the welfare change will be identified.
The diagram could show the market equilibriumpoint which does not take into account the existence of anegative consumption externality and may compare this with the allocatively efficient level of output when the negative externality is taken into account. The diagram may be amended or re-drawn to show the impact of achosen policy(ies) and the impact on consumption or production shown.
Reference to the diagram and the outcomes it illustrates is made in the text.
AO3 Evaluation
A government might introduceasubsidy for alternative forms of transport e.g. mass rapid transport to encourage production to enable allocative efficiency, however it is difficult to measure the precise value of the subsidy. Subsidies have opportunity costs and are costly in that the funds might have been used by governments for other purposes. This means governments will have to make a value judgement when deciding whether to provide a subsidy.
Consumer demand for alternatives may be low due to the reluctance to price in-elasticity of demand for public transport/alternatives.
The impact on price and output in some circumstances takes along time to become effective.
Advertising of alternative methods of transportis often costly and it is not always certain that it will have a sufficiently persuasive effect to ensure the correct level of consumption is reached.
Public sector provision is costly and sometimes less efficient than that provided through market forces.
Accept all valid responses.
Question 2Oct/Nov 20259708/4320 marks
2 With the help of a diagram, evaluate the impact on consumers and producers of an increase in market contestability. [20]
Show mark scheme
With the help of a diagram, evaluate the impact on consumers and producers of an increase in market contestability.
Use Table A: AO1 Knowledge and understanding and AO2 Analysis and Table B: AO3 Evaluation to mark candidate responses to this question.
AO1 and AO2 out of 14 marks. AO3 out of 6 marks.
Indicative content Responses may include:
AO1 Knowledge and understanding and AO2 Analysis
Market contestability should be explained by referring to how open a market might be to new competition.
Existing factors which might limit contestability can be identified, including examples of barriers to entry, particularly high sunk costs.
Recognition and description of the conditions that will exist when a market is not contestable. A clearly labelled, accurate diagram should be provided showing profit maximization price and output. (accept either Oligopoly or Monopoly diagram)
Analysis should examine the impact on consumers when barriers to entry are removed. A diagram could be used to indicate that consumers might benefit from lower prices and more choice
Analysis can be used to assess the impact of an increase in contestability on firms. It is likely that abnormal profits might be reduce.
Analysis could also be used to indicate why contestability might create incentives for a business to reduce their unit costs by avoiding any X- inefficiencies
AO3 Evaluation
The removal of barriers to entry and a subsequent loss of market share might mean that a firm cannot benefit from economies of scale to the same extent. It is possible that as a result of this lower prices might not be passed on to the consumer.
The respective impact on consumers and producers will be determined by the degree of contestability introduced and how well it can be maintained.
The type of industry will also determine whether an increase in contestability will have a positive effecton consumers and producers. For example, natural monopolies by their nature, are unlikely to become more efficient when barriers to entry are removed.
Firms with high barriers to entry may lose the opportunity to make sufficient abnormal profits to ensure dynamic efficiency is maintained. This may lead to higher prices for some consumers.
A conclusion should be attempted which examines the net benefits that might be gained by introducing more contestable markets to either/or consumers/producers
Accept all valid responses. No diagram L2 Max
AO1 Knowledge and understanding and AO2 Analysis
AO3 Evaluation
Case study: Market Economies
From Adam Smith onwards, most economists have regarded competitive markets as the main mechanism of economic activity. They argue that the interaction between producers and consumers can lead to both allocative efficiency and productive efficiency.
It can, however, be questioned whether the market automatically produces the best solution. Sometimes there are significant reasons for governments to intervene in a market in order to produce a better outcome than market forces alone. These situations are market failures.
When producing goods and services firms consider the private costs they pay and private benefits they receive. For example, a steel producer accounts for the cost of iron ore, fuel, labour and administration. It offsets these costs against the revenue from selling the steel. However, those people who live near the steelworks suffer the consequences of the noise, dirt and polluted air generated as part of the production process. Similarly, in many areas the extraction of iron ore can lead to environmental destruction such as the degradation of ground water for domestic consumption and a reduction in the variety of wildlife and flowers.
Competitive markets as envisaged by economists, however, may not exist. Firms may integrate to gain the benefits of economies of scale, to realise their ambition to rule the market or to increase their market share. Such integration might lead to the development of a monopoly market structure. Many believe that a monopoly always operates against the interests of the consumer because of its lack of efficiency. As a result, governments often restrict the operation of monopolies.
Question 1(a)Oct/Nov 20259708/444 marks
(a) Explain the meaning of ‘allocative efficiency and productive efficiency’. [4]
Show mark scheme
Explain the meaning of ‘allocative and productive efficiency’. Allocative efficiency is when firms produce what consumers want (1) MC=AR/MC =P. (1) Productive efficiency is producing goods and services with the least use of resources. (1) Production on the lowest average cost curve/ minimum average cost/AC =minimum (1) Producing on the PPC 1
Question 1(b)Oct/Nov 20259708/448 marks
(b) (i) Explain what is meant by a negative production externality. [2]
(ii) Identify from the extract a negative production externality resulting from steel production. [1]
(iii) Explain, with the aid of a diagram, the consequences for output and price if the steel market is required to take into consideration negative production externalities. [5]
Show mark scheme
Explain what is meant by a negative production externality. A cost 1 that is born by someone other than the producer of the good/a third party 1 Identify from the extract, a negative production externality resulting from steel production. Noise, dirt or polluted air 1
Max 1 mark Explain, with the aid of a diagram, the consequences for output and price if the steel market is required to take into consideration negative production externalities. 1(b)(ii) cost/benefit MPB MSC MPC Negative P Externally P Q Q Quantity 1 Labels 1 Axes 1 and explicit indication of negative externality 1 Comment: Quantity falls from Q to Q 1 and Price increases from P to P 1 1 1 Welfare loss explained 1
Question 1(c)Oct/Nov 20259708/448 marks
(c) Consider whether ‘a monopoly always operates against the interests of the consumer’. [8]
Show mark scheme
Considerwhether‘a monopolyalways operates against the interests of the consumer’. In favour of monopoly :
Economies of scale 1, + explanation 1
Investment in research and development 1, + explanation 1 Natural monopoly e.g. railways 1, + development 1
Max 4 Against monopoly: Loss of productive efficiency 1 + explanation 1 Loss of allocative efficiency 1 + explanation 1 Lack of dynamic efficiency1 + explanation Or: A diagram showing the loss of allocative and productive efficiency Axes/Labels 1 correct costs and revenues 1 loss of AE 1 loss of PE 1
Max 4
Max 7 for argument Conclusion: 1 essay
Question 2Oct/Nov 20259708/4420 marks
2 Evaluate, with the aid of a diagram, whether the diminishing marginal utility theory of demand provides an adequate explanation of the market demand curve for all goods and services. [20]
Show mark scheme
Evaluate, with the aid of a diagram whether the diminishing marginal utilitytheoryof demand provides an adequate explanationof the market demand curve for all goods and services. Use TableA:AO1 Knowledge and understanding andAO2 Analysis and Table B: AO3 Evaluation to mark candidate responses to this question.
AO1 and AO2 out of 14 marks. AO3 out of 6 marks.
Indicative content Responses may include:
AO1 Knowledge and understanding and AO2 Analysis Assumptions of marginal utility analysis including:
rational consumers who prefer more to less, atwo-good world, the goods can be substituted for each other, perfect knowledge of the market.
Definition of marginal and total utility.
Explanation of diminishing marginal utility.
The analysis of the change in the price of a good and the explanation of how much the consumer will purchase as the price changes.
The use of the equi-marginal principle to establish how consumers ‘balance’ their expenditure on goods as the price of one of themchanges.
The horizontal addition of individuals’ demand curves to achieve the market demand curve.
AO3 Evaluation
Consumer rationality: marginal utility theory assumes that consumers act rationally. They are of a calculating mind, carrying numerous combinations of different commodities in their heads, can substitute one for the other, compare their total utilities and make a rational choice between various combinations of goods.
Marginal utility theory has no provision for income and substitution effects so does not explain inferior goods.
It is difficult to compare the concept of changing the demand for expensive goods which are purchased infrequently with goods such as consumables. which are one-off indivisible purchases and the choice is between, for example, 1 fridge and 4 weeks’ food.
A consumer is faced with a much more complex world than the two-good world of the model because a consumer buys not just two but a large number of commodities to satisfy their innumerable wants.
Accept all valid responses.
AO1 Knowledge and understanding and AO2 Analysis
AO3 Evaluation
Question 3Oct/Nov 20259708/4420 marks
3 Subnormal and supernormal profits are only experienced in the short run and only by firms in perfect competition.
With the help of diagrams, evaluate this statement. [20]
Show mark scheme
Subnormal and supernormal profits are only experienced in the short run and only by firms in perfect competition. With the help of diagrams, evaluate this statement.
Use Table A: AO1 Knowledge and understanding and AO2 Analysis and Table B: AO3 Evaluation to mark candidate responses to this question.
AO1 and AO2 out of 14 marks. AO3 out of 6 marks.
Indicative content Responses may include:
AO1 Knowledge and understanding and AO2 Analysis
Definition of short run, subnormal and supernormal profits.
Statement of the conditions for perfect competition.
Analysis of the applicability of the concepts of subnormal and supernormal profits in the context of perfect competition.
The resolution of subnormal and/or supernormal profits to equilibrium normal profits in perfect competition in the long run.
A relevant diagram to show the analysis.
AO3 Evaluation
The analysis of monopolistic competition to show subnormal and supernormal profits and their resolution to normal profit.
Monopoly analysis to show that supernormal profits may exist in the long run.
Analysis of oligopoly to show that there may or not be subnormal or supernormal profits in the both the short run and the long run.
Accept all valid responses.
AO1 Knowledge and understanding and AO2 Analysis
AO3 Evaluation
Question 2May/June 20259708/4120 marks
2 With the help of a diagram, evaluate the use of indifference curve analysis to explain the relationship between a change in the price of a product and the change in an individual consumer’s demand for this product. [20]
Show mark scheme
With the help of a diagram, evaluate the use of indifference curve analysis to explain the relationship between a change in the price of a product and the change in an individual consumer’s demand for this product.
Use Table A: AO1 Knowledge and understanding and AO2 Analysis and Table B: AO3 Evaluation to mark candidate responses to this question.
AO1 and AO2 out of 14 marks. AO3 out of 6 marks.
Indicative content Responses may include:
AO1 Knowledge and understanding and AO2 Analysis
An explanation of what is meant by an indifference curve and an indifference curve map.
Explanation of a budget line and understanding of how a change in price or how a change in real income will affect a budget line
Demonstration of an understanding of consumer equilibrium.
Use of a diagram to analyse the links between indifference curves, budget lines and consumer equilibrium.
Analysis of how a change in price might affect consumer equilibrium. This can be supported by a clear, accurately labelled diagram.
Analysis of each element of the price effect on individual consumer demand. Both substitution effects and real income effects should be considered to attain Level 3 No diagram-highest mark is L2 – 8
AO3 Evaluation
Recognise that the key assumptions regarding human behaviour will determine the shape of the indifference curve. For example, it is assumed that all consumers attempt to maximise satisfaction.
Although the analysis only considers ‘bundles’ of two good consumed, it still assumes the consumer can correctly distinguish between different levels of satisfaction between different ‘bundles’.
The analysis only considers a choice between two goods. Consumers have the opportunity to consider alternative prices of a wide range of goods before choosing what to purchase.
Other factors such as advertising might change consumer taste, which in turn, will change the shape of the indifference curve and, ultimately the final impact of a price change on consumer demand.
A conclusion should be attempted which examines the effectiveness of the use of indifference curve analysis to predict the impact of a price change on individual consumer demand.
Accept all valid responses
Question 3May/June 20259708/4120 marks
3 The growth of a firm using a takeover is desirable because it enables consumers to benefit from lower prices and the firm to gain additional profits.
Evaluate this statement. [20]
Show mark scheme
The growth of a firm using a takeover is desirable because it enables consumers to benefit from lower prices and the firm to gain additional profits. Evaluate this statement.
Use Table A: AO1 Knowledge and understanding and AO2 Analysis and Table B: AO3 Evaluation to mark candidate responses to this question.
AO1 and AO2 out of 14 marks. AO3 out of 6 marks.
Indicative content Responses may include:
AO1 Knowledge and understanding and AO2 Analysis
Recognition that a takeover can be classified as a factor determining the external growth of a firm
Differentiates between a takeover, which occurs when one firm buys another firm and a merger which takes place when two firms unite to form one new company
Takeovers can relate to different stages of production. For example, horizontal, vertical integration.
Analysis should refer to the benefits associate with gaining economies of scale via horizontal integration. For example, lower costs and lower prices for the consumer
Analysis could also be used by referring to backward/forward vertical integration which might lead to further cost savings which can be passed on to the consumer.
Firms might also increase profits by increasing their market share and increasing their total revenue
AO3 Evaluation
The cost benefits of economies of scale might not be passed on to the consumer through lower prices
An increase in market share might increase monopoly power and allow the firm to control output and charge higher prices to the consumer.
Some takeovers can be very costly in the long run and this may decrease profits in the long run.
A takeover will create a much larger organization which may have to deal with unexpected communication problems which increase costs and reduce profits
Some takeovers might lead to intervention by the competition authorities which might result in price regulation
Culture clashes may arise within firms involved which may lead to diseconomies of scale and rising consumer prices
A conclusion should attempt to address each element of the statement. The key words ‘low consumer prices and ’increased profits’ should be considered in the light of the preceding argument.
Accept all valid responses.
AO1 Knowledge and understanding and AO2Analysis
AO3 Evaluation essay
Case study: Global carbon emissions
A key message of the 2021 World Climate Summit was that the use of coal must be phased out for the good of the planet.
Content removed due to copyright restrictions.
Content removed due to copyright restrictions.
Instead, a mixture of renewable energies will be required to achieve zero-carbon
Sources: The Sunday Times, 17 October 2021 The Times, 26 October and 24 November 2021 nsenergybusiness.com, 4 November 2021
Question 1(b)May/June 20259708/424 marks
(b) Use the information to comment on the possible effects on the economies of the countries that refused to sign the carbon policy agreement. [4]
Show mark scheme
Use the information to comment on the possible effects on the economies of the countries that refused to sign the carbon policy agreement. Those countries are some of the top producers of coal. (1) Advantages: Cheapness as a power source 1 enabling them to increase/maintaining GDP/Economic Growth 1. Reliable source of power1 enabling continuity of production 1. Coal supplies can be stored and managed 1 to meet demand for electricity 1. Disadvantages: Coal is a finite resource 1 and therefore there are future costs of switching 1. Continuation of the output of negative externalities 1 e.g. carbon dioxide/greenhouse/toxic gases/lower air quality 1. 4 max
Question 1(d)May/June 20259708/4210 marks
(d) With the help of a marginal social cost and benefit diagram discuss whether the continued use of coal to produce electricity makes the achievement of allocative efficiency less likely. [10]
Show mark scheme
With the help of a marginal social cost and benefit diagram discuss whether the continued use of coal to produce electricity makes the achievement of allocative efficiency less likely. Definitions of: private cost 1, external cost/social cost, 1 allocative efficiency 1. External costs of coal/‘dirty fuel’/greenhouse gases/pollution 1 3 countries produce 52% of global CO emissions from coal use 1 2 Correct axes with Discussion: correct drawing and $/P/C/B MSC MPC labels of MPB/MSB and MPB/MSB MSC, MPC 1 Indication of Externality/Welfare loss 1 Correct identification Q* of Q* and Q 1 Q Output/Quantity Coal production/burning has negative externalities which mean MSC is greater than MPC. 1 Conclusion: This means the allocative efficient output is Q* not Q/allocative efficiency is not achieved 1.
Question 2May/June 20259708/4220 marks
2 Monopolies restrict output to raise prices to exploit consumers.
With the help of a diagram, assess the extent to which a government should intervene in monopoly markets. [20]
Show mark scheme
Monopolies restrict output to raise prices and exploit consumers. With the help of a diagram, assess the extent to which a government should intervene in monopoly markets.
Use Table A: AO1 Knowledge and understanding and AO2 Analysis and Table B: AO3 Evaluation to mark candidate responses to this question.
AO1 and AO2 out of 14marks. AO3 out of 6 marks.
Indicative content Responses may include:
AO1 Knowledge and understanding and AO2Analysis
The key characteristics of a monopoly market structure should be identified.
The aim of profit maximization should be explained and an accurately labelled supporting diagram should be provided to illustrate this situation.
Analysis should be provided, based on a diagram, which shows the links between low output, high prices and allocative inefficiency.
Alternative government policies to reduce the power of monopolies should be explained.
Diagram(s) may be provided to illustrate monopoly equilibrium and/or the policy suggested.
Analysis of how alternative types of government intervention can be used to address some of the negative outcomes associated with monopoly firms. No monopoly diagram Max L2 8 marks.
AO3 Evaluation
Accept all valid responses.
A government can use taxation to reduce monopoly profits and control market power. However, this might reduce the incentive to invest by monopoly firms and lead to X inefficiency
Maximum pricing might be introduced to control high prices but this might lead to shortages and/or the operation of underground markets.
Some types of product/service can be described as natural monopolies, therefore any attempt to introduce more competition is simply likely to lead to more inefficient outcomes.
Direct government intervention by regulation/legislation might reduce a monopoly market share but this would also make it more difficult for a monopoly to benefit from economies of scale. Hence, costs and prices might subsequently rise.
A conclusion should attempt to examine alternative types of government intervention to try and establish the extent to which governments should intervene in monopoly markets.
Accept all valid responses.
AO1 Knowledge and understanding and AO2Analysis
AO3 Evaluation
Case study: Economic development in Bangladesh
Since 1971 Bangladesh has experienced significant economic development, moving from the low-income to the lower-middle-income country classification. Gross National Income (GNI) per capita at constant 2017 prices in United States dollars ($) rose from $2342 to $5823 between 2000 and 2020. Over the same period, the country’s Human Development Index (HDI) rose from 0.49 to 0.66.
During this period, Bangladesh underwent changes in employment as it moved from the agricultural sector to the manufacturing and services sectors.
First, in agriculture, output increased by more than 100% whilst employment fell from 65% to 38% of the working population. This change was helped by innovation in crop irrigation, land preparation and harvesting, aided by the development of local industries to provide the capital equipment needed.
A second source of economic development was the growth in the clothing industry producing ready-made garments (RMG) that contributed about 11% of Bangladesh’s Gross Domestic Product (GDP) and employed 4.4 million workers of which 2.5 million were women (2020). The industry uses significant division of labour with production split into 10 or more processes, for example, cutting, sewing zips, assembly and packaging.
The value of raw materials imported for the RMG industry was about half of the value of the industry’s exports. Net exports from this sector stood at $23 billion. This enabled Bangladesh to both import a wider range of goods and services and reduce the deficit on its balance of trade in goods.
In 2020, there were more than 4000 RMG manufacturers in Bangladesh, differentiated by the quality of their products and the speed of their delivery. The RMG industry supplied more than 100 major US and European retailers.
However, the RMG industry has critics who point to air and water pollution from the chemicals used in cotton growing and manufacturing clothes. The industry is also accused of employing child labour and of having poorly constructed factories.
Sources: Bangladesh overview: World Bank, 11 April 2024 and Quarterly Review on Readymade Garments, Bangladesh Bank Research Department, 14 February 2023
Question 1(b)May/June 20259708/443 marks
(b) The passage states that the RMG industry ‘uses significant division of labour’. Explain how this is likely to affect the average costs of firms in Bangladesh’s RMG industry. [3]
Show mark scheme
The passage states that the RMG industry ‘uses significant division of labour’ takes place. Explain how this is likely to affect the average costs of firms in Bangladesh’s RMG industry. Division of labour increasing labour productivity/Increased efficiency (1) Definition of division of labour e.g. cutting, sewing zips, (1), and hence reduces average total costs (1).
Question 1(c)May/June 20259708/446 marks
(c) Identify the probable market structure of the RMG industry in Bangladesh and with the help of a diagram, consider the likely effect on the level of long-run profits of firms in this industry. [6]
Show mark scheme
Identify the probable market structure of the RMG industry in Bangladesh and with the help of a diagram, consider the likely effect on the level of long-run profits of firms in this industry. Identification of Monopolistic Competition 1
Diagram 3 marks: Labels and axes 1 Identification of MC=MR for profit maximisation 1 Average cost and revenue/marginal costs and revenue curves 1 Explanation of why Normal Profits 1 in long run equilibrium 1 If correct analysis but market mis-identified as monopolistically up to 5
Question 2May/June 20259708/4420 marks
2 With the help of a diagram, consider whether economic efficiency can be achieved without government intervention in a market economy. [20]
Show mark scheme
With the help of a diagram, consider whether economic efficiency can be achieved without government intervention in a market economy Use TableA: AO1 Knowledge and understanding and AO2 Analysis and Table B: AO3 Evaluation to mark candidate responses to this question.
AO1 and AO2 out of 14marks.
AO3 out of 6 marks.
Indicative content Responses may include:
AO1 Knowledge and understanding and AO2Analysis
Definition and demonstration of productive efficiency in terms of minimum AC and allocative efficiency MC=MR.
Candidates may approach the question from a number of points of view
Comparison of equilibrium in Perfect Competition with reference to definitions of efficiency.
Negative externalities (e.g. the effects of environmental pollution) causing the social cost of production to exceed the private cost or positive externalities (e.g. the provision of education and health care) causing the social benefit of consumption to exceed the private benefit
Imperfect information or information failure means that merit goods are under-produced while demerit goods are over-produced or over- consumed.
The lack of supply of pure public goods and quasi-public goods issue that are needed to meet people's needs and wants.
Market dominance by monopolies can lead to under-production and higher prices than would exist under conditions of competition and the effect on price and quantity produced and consumer welfare.
Factor immobility causes unemployment and a loss of productive efficiency.
Equity (fairness) issues. Markets can generate an 'unacceptable' distribution of income and consequent social exclusion which the government may choose to change.
A choice of government policy to address a market failure from:
specific and ad valorem indirect taxes, subsidies, price controls, production quotas, prohibitions and licences, regulation and deregulation, direct provision, pollution permits property rights, nationalisation and privatization, provision of information or behavioural insights and ‘nudge’ theory. No Diagram Max L2 8
AO3 Evaluation
Opportunity costs of the policy that has been chosen, what are the alternative uses of the resources and how does it affect efficiency.
Can the government accurately measure the extent of the market failure.
Unintended consequences on, regulator capture, cost of bureaucracy, political interference.
Evaluation may be based on an example cited by candidates.
Implications for the government budget increase in tax revenues/costs of subsidies.
Accept all valid responses.
AO1 Knowledge and understanding and AO2Analysis
AO3 Evaluation
Question 2Feb/March 20259708/4220 marks
2 Oligopolies are able to avoid price competition while maintaining supernormal profits in the long run.
Evaluate this statement. [20]
Show mark scheme
Oligopolies are able to avoid price competition while maintaining supernormal profits in the long run. Evaluate this statement. Use TableA:AO1 Knowledge and understanding andAO2 Analysis and Table B: AO3 Evaluation to mark candidate responses to this question.
AO1 and AO2 out of 14 marks. AO3 out of 6 marks.
Indicative content Responses may include:
AO1 Knowledge and understanding and AO2Analysis
Key characteristics of an Oligopoly market structure.
Explanation of the kinked demand curve and price rigidity.
Recognition that Game theory might predict stable prices through Nash equilibrium.
Analysis of how barriers to entry might enable abnormal profits to be maintained in the long run.
Analysis of how collusion might enable abnormal profits to be maintained in long run.
Analysis of use of limit pricing to maintain abnormal profits in long run.
Alternatives such as non-price competition might be used to maintain profits in long run
AO3 Evaluation
Collusion to establish common prices is often illegal and also in some circumstances, difficult to maintain.
It might be difficult to maintain barriers to entry if agovernment introduces legislation to promote more contestable markets.
The extended use of limit pricing might have a significant negative impact on profitability in the short run which might reduce investment and dynamic efficiency in the long run.
The use of non-price competition based on advertising and/or product differentiation might be costly and significantly reduce profits.
Some Oligopolies might prefer to adopt abreak-even pricing policy in the long run to increase market share, rather than maximizing profits.
A conclusion should be attempted which uses the precedingdiscussionto evaluate the statement under consideration
Accept all valid responses.
AO1 Knowledge and understanding and AO2Analysis
AO3 Evaluation
471 more questions from 2020–2024
🔒 Unlock every Unit 7: The price system and the microeconomy question from 2020–2024
All 471 come with their mark schemes, answers and case studies, and appear in the practice tool above once you’re signed in. It’s free.
9708/31 · Oct/Nov 2024 · Question 2What is a characteristic of an indifference… 🔒
9708/31 · Oct/Nov 2024 · Question 3A Belgian traffic study concluded that there… 🔒
9708/31 · Oct/Nov 2024 · Question 6LMN Ltd operates as a relatively small… 🔒
9708/31 · Oct/Nov 2024 · Question 8What is a characteristic of… 🔒
9708/31 · Oct/Nov 2024 · Question 9What is likely to have its cause… 🔒
+ 466 more, by year in the table above
Questions and mark schemes are from past Cambridge papers and are reproduced for revision. Topical Vault is an independent revision resource, not affiliated with or endorsed by Cambridge Assessment International Education.
A Level Economics questions by topic
Each topic opens this practice tool with only that topic’s questions, plus how often it comes up and every question on it in one list.
Pick a paper, sub-topics and years to draw from (leave any blank for "all"), choose
how many questions you want, and we'll open a new worksheet page with a random set for you to review
and download.